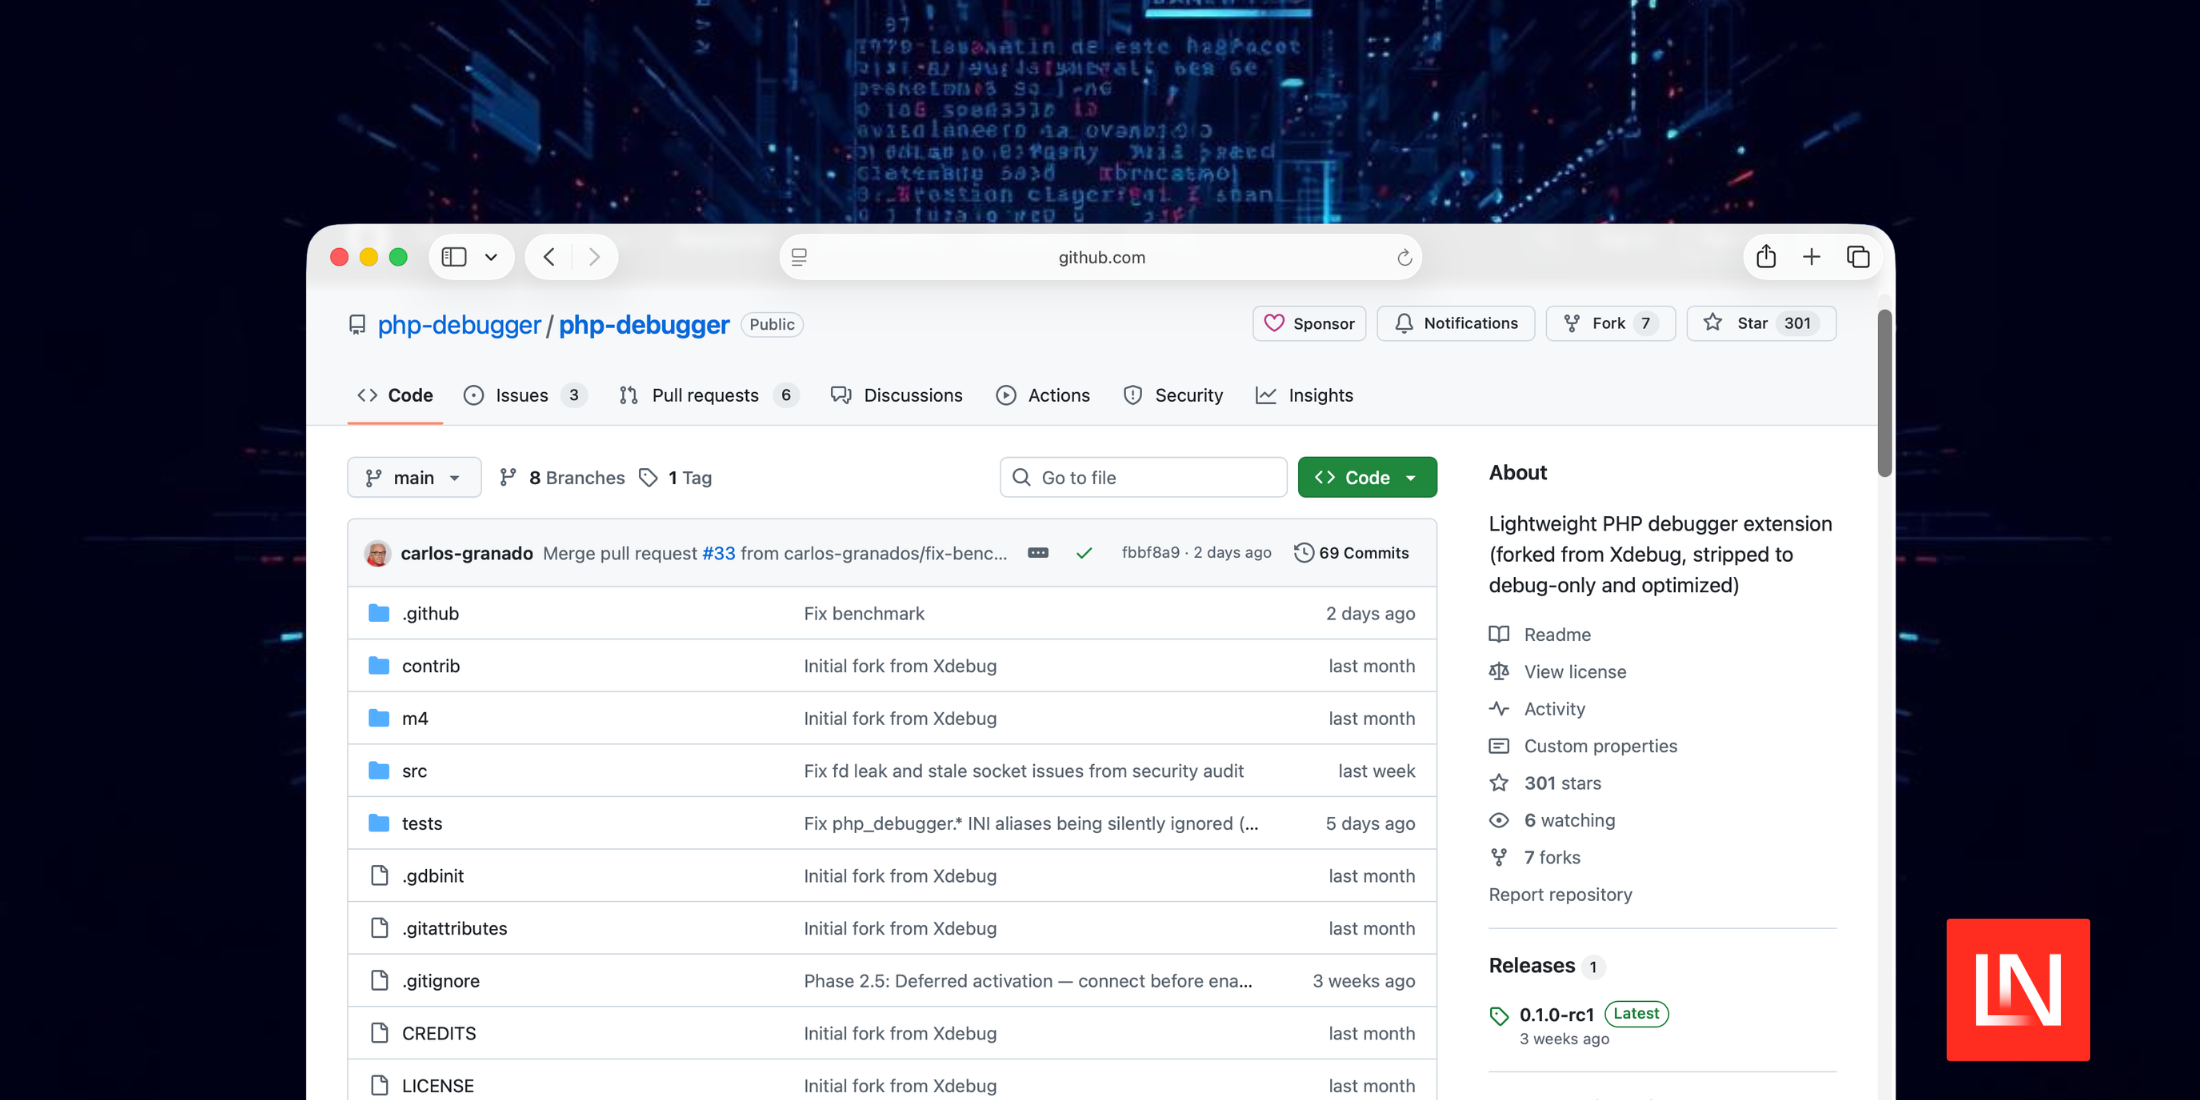
PHP Debugger is a new PHP extension forked from Xdebug that removes everything except step debugging — no profiler, no code coverage, no tracing. The goal is a drop-in replacement that carries far less overhead when the debugger is loaded but not actively in use.
Near-Zero Idle Overhead
Benchmarks using Valgrind instruction counting (run in GitHub Actions across PHP 8.2–8.5) show the overhead when the extension is loaded with no IDE connected:
| Benchmark | Xdebug | PHP Debugger |
|---|---|---|
| bench.php (synthetic) | +661.6% | +12.9% |
| Rector (processing a file) | +124.5% | +3.6% |
| Symfony request | +35.3% | +1.3% |
Drop-In Xdebug Replacement
PHP Debugger accepts both php_debugger.* and xdebug.* INI prefixes, so existing configurations work without changes:
; Your existing Xdebug config works as-is:xdebug.mode = debugxdebug.client_host = 127.0.0.1xdebug.client_port = 9003xdebug.start_with_request = trigger ; Or use the new prefix:php_debugger.mode = debugphp_debugger.client_host = 127.0.0.1php_debugger.client_port = 9003php_debugger.start_with_request = triggerThe extension also reports true for extension_loaded("xdebug"), which means packages that check for Xdebug at runtime will continue to work. PhpStorm and VS Code both work without any configuration changes.
Debug-Only Focus
By removing profiling, tracing, and code coverage, the extension stays focused on one use case: setting breakpoints and stepping through code.
| Feature | PHP Debugger | Xdebug |
|---|---|---|
| Step debugging (DBGp) | Yes | Yes |
xdebug_break() |
Works | Works |
XDEBUG_SESSION trigger |
Works | Works |
| Code coverage | No (use pcov) | Yes |
| Profiling | Removed | Yes |
| Tracing | Removed | Yes |
If you need code coverage, the project recommends pcov as a separate extension.
New PHP Debugger-Specific API
Alongside full Xdebug compatibility, the extension exposes its own function names and triggers as optional alternatives:
// Xdebug-compatible (still works):xdebug_break(); // PHP Debugger equivalents:php_debugger_break();php_debugger_info();php_debugger_connect_to_client();php_debugger_is_debugger_active();php_debugger_notify();Session triggers follow the same pattern. XDEBUG_SESSION, XDEBUG_SESSION_START, and XDEBUG_TRIGGER all work, and the new PHP_DEBUGGER_SESSION, PHP_DEBUGGER_SESSION_START, and PHP_DEBUGGER_TRIGGER equivalents are available as well.
Installation
Binaries are available on the releases page. After downloading the right binary for your PHP version, add the extension to your php.ini:
zend_extension=php_debugger.soThe project is also an interesting case study in AI-assisted development. According to the README, the entire extension — fork, strip, optimize, rename — was built in days using PhpStorm, Claude Code, and OpenClaw.
You can get started with this extension on GitHub.