Software applications are increasingly critical for businesses today. They perform key customer-facing roles, power back-office activities, and help us gain greater insight into business activities.
Using software gives us greater efficiency and leverage, but can come at a cost in terms of transparency. It can be hard to see how well customers are being served, where they are struggling, or understand why parts of the business aren't working as expected.
Application Performance Monitoring (APM) solutions solve this problem by allowing you to see what is happening inside your software applications in real-time. APM can give you the information to reduce cost, lower churn, and prevent interruptions in the availability of your business. Better understanding your customer interactions can give you paths to increase revenue and retention as well.
APM is increasingly essential for any business that relies heavily on software, especially in customer-facing capacities.
If you are new to APM it may sound intimidating, but don't worry - in this post we'll break down how APM works and what it can do for you.
Here's a quick overview of what we'll cover. Feel free to skip ahead as makes sense for you:
- What is Application Performance Monitoring (APM)?
- Why is App Performance Monitoring so important?
- APM Software Metrics: What does APM encompass?
- Examples of how Application Performance Monitoring can help
- Choosing the best APM Tool for your business
- Best practices in APM
What is Application Performance Monitoring (APM)?
Application Performance Monitoring (APM) allows you to see exactly what your applications are doing (and why) while they execute the functions of your business. What makes APM so powerful are the abilities to:
- See exactly what your applications are doing while interacting with real users
- Discover problems that may be limiting sales, keeping customers from using your product successfully, or damaging your brand experience
- Identify when your applications are struggling and why
- Identify where applications are wasting resources so you can tune to reduce expenses and increase availability
- See historical trends and proactively prevent service outages
APM systems work by giving your applications the ability to report key information, including which code is running, how many requests are happening, where your application is spending time in delivering requests, and when things are breaking (including how often).
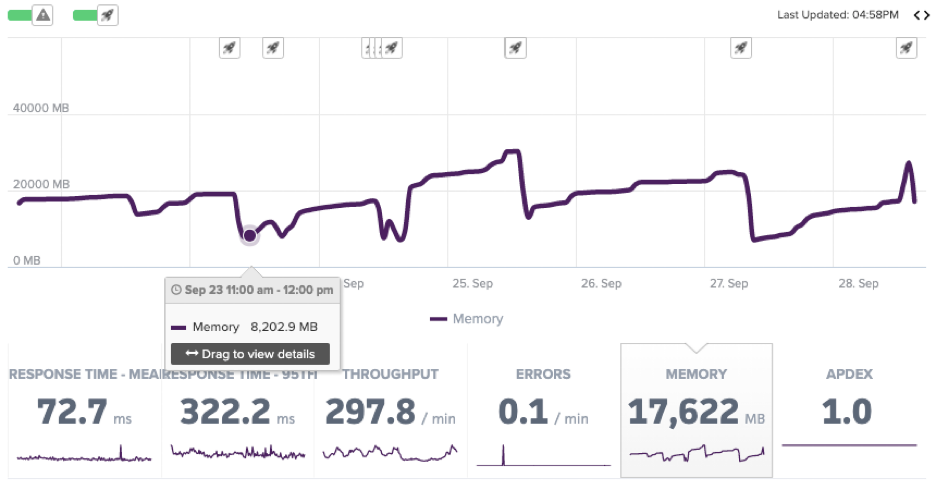
This information is gathered up by the APM service and presented in a way that is easy to understand and troubleshoot. You are able to review what is happening with your application as a whole including request volume, response time, error rates, memory usage, variances between instances of your application, and much more.
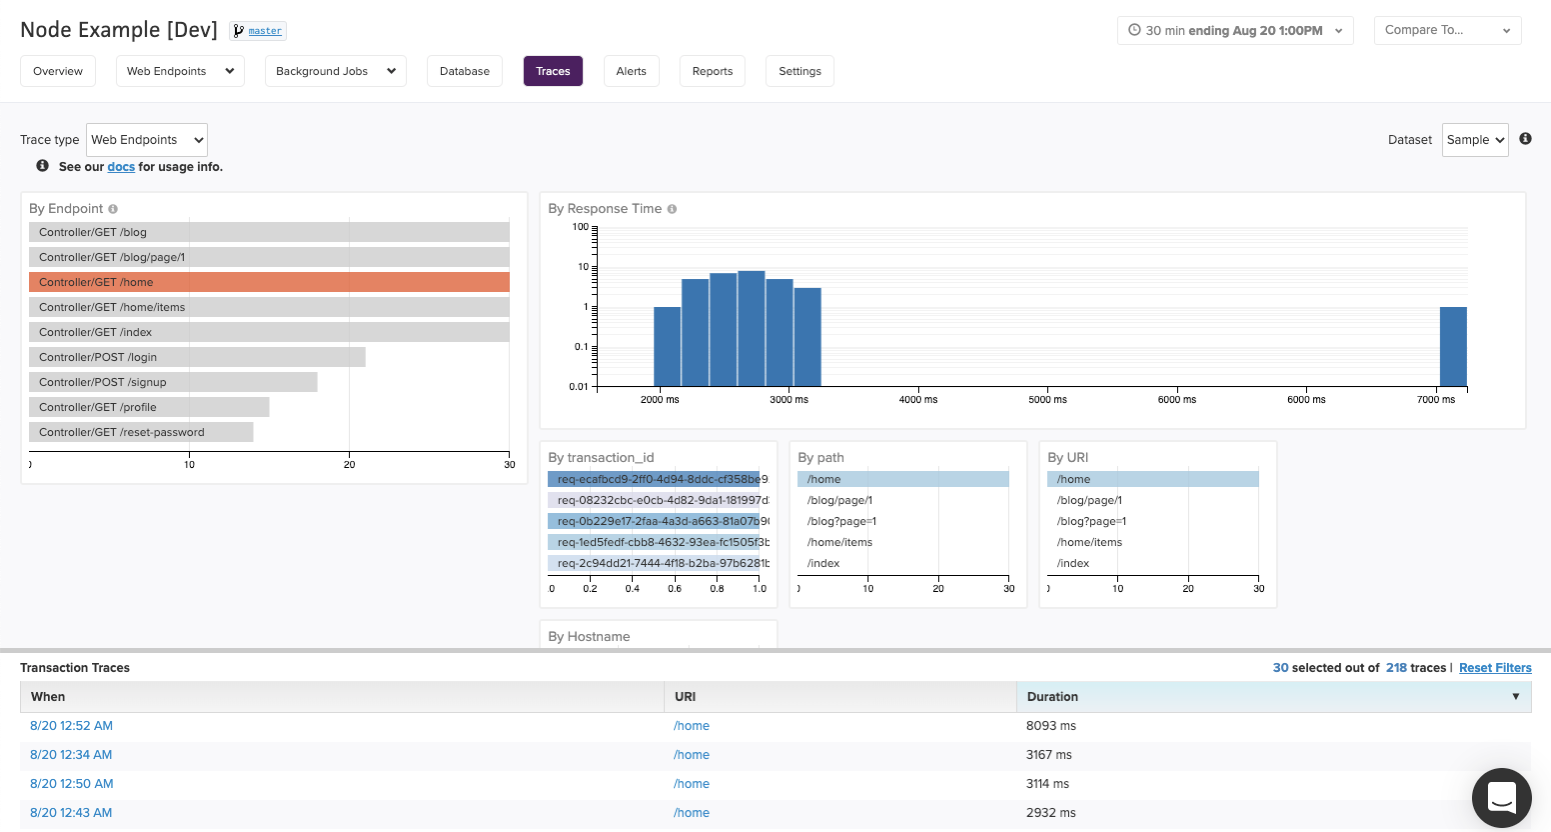
You can also dig into the details of specific requests (or sets of requests) to understand what is driving their performance or failures. This can include things like identifying memory leaks, wasted execution cycles, slow database queries, and more.
APM encompasses many ways to get better insights into your applications. We'll dig even more into the details on what APM can do for you a little later in the post.
Why is App Performance Monitoring So Important?
Have you ever tried to buy something online, only to give up because the company's website was slow, buggy, or unresponsive? Have you ever tried to use a service you pay for and rely on, only to see it broken or unavailable? How do you feel about these companies after this happens? Do you want to keep doing business with them?
In the age of always-on applications, providing a responsive, stable experience to your customers is critical. So is identifying defects in your software quickly, understanding their impact, and being able to correct them promptly.
As software and the way it is deployed increase in complexity, so do the ways it can fail. Complex cloud deployments, elastic infrastructure, and containerization increase scalability and performance, but also introduce new ways for your applications to break in less obvious ways. Partial degradation is now more common than outright failure. It is not unusual that aspects of your applications can be broken for some customers even while they work fine for your team.
APM allows you to see what is really happening with your applications as it happens. This means you can identify problems quickly and correct them - or better yet anticipate them before customers are ever impacted.
Using APM also has direct benefits for software teams. A solid understanding of what is actually happening with your production applications helps teams prioritize by:
- Identifying which bugs customers are encountering and at what rate
- Understanding which areas of your application get the most use
- Determining opportunities for expanding your application's value or capturing more market share
- Focusing their efforts on the initiatives that yield the highest returns for your business
In summary, APM gives you critical insights to understand what is really happening as you serve your customers. This allows you to stop guessing and make informed decisions to increase application stability, reduce costs, and win more business.
APM Software Metrics: What Does Application Performance Monitoring Encompass?
APM tracks a number of aspects of your running applications, helping you understand both how applications are running right now and what that means given a historical perspective. APM helps you to:
- Understand how your applications are being used: how many users are using the system at once? for how long? where are they having problems? are specific subsets of users poorly served? what is causing a problem for a specific customer?
- Understand your requests: how much traffic are you receiving? from where? how fast are you responding? which aspects of the application are slow?
- Understand your resource usage: how much CPU are you using? is your application leaking memory? are processes bloated because of poor code execution? are you running unnecessary database queries? will your application scale gracefully with growth?
- Track how things are changing: what are the impacts of new deploys? are you introducing new problems? are you fixing the problems you think you are?
- Know what isn't working: is your application experiencing errors? why? who is affected? are specific code paths or database queries slowing down your application? what can you do to fix things?
Common metrics for APM solutions include:
- Request rates (traffic throughput) and response time
- 95% Response time
- Load Balancer queue time
- Application resource usage (CPU, Memory)
- Apdex (User Satisfaction)
- Error rates (application degradations and failures)
In addition, some tools have more advanced functionality including:
- Segmenting requests by specific users
- Deep language-specific code tracing
- Automatic detection of database query performance improvement opportunities
- Intelligent tracking of memory allocations and memory bloat
Examples of How Application Performance Monitoring Can Help
Let's dive into some specific examples to better understand how APM can help you:
- Why is my application slow?
- Are all requests slow or just some of them? Who is affected?
- How can I optimize my operations to spend less money?
- How long has this been happening? Who has been affected?
- What are my users doing? What do they like and want more of?
Why is my application slow?
One of the most common issues with applications is poor performance. This can manifest as poor initial loading times, slow operations, or the dreaded "hung" feeling when an application becomes unresponsive.
Poor performance has a real financial impact as well - a recent study shows that web conversion rates drop by an average of 4.4% with each additional second of load time.
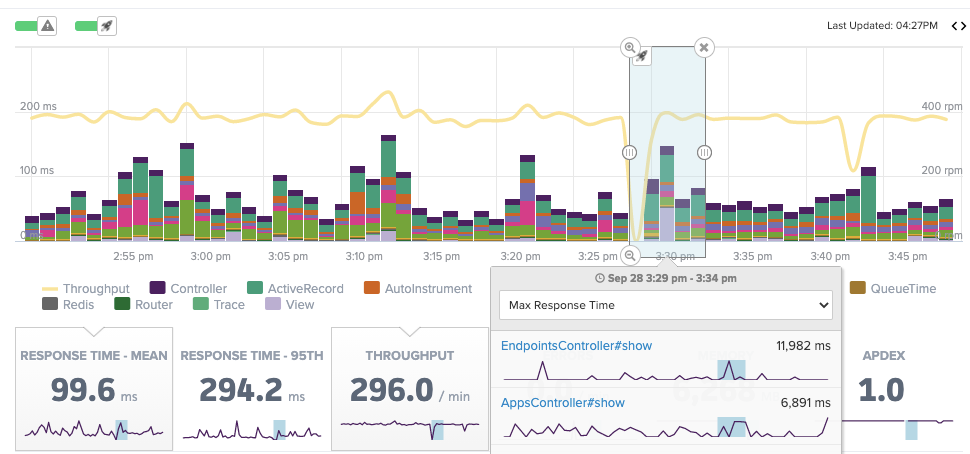
A good APM solution will show you response time (mean and key percentiles) for your application as a whole and also will make it easy to drill down into performance for specific routes or code paths. This allows you to quickly determine which parts of your application are running as they should and which parts are contributing to poor performance and loss of revenue.
Are all requests slow or just some of them? Who is affected?
For most applications, different types of requests can vary greatly in speed. Exploring your performance visually makes it easy to determine which code paths are problematic and which customers have been affected.
APM solutions that allow you to identify users or annotate requests with other custom context are more powerful for these kinds of questions. They can allow deeper segmentation and make it easy to identify requests affecting a particular customer.
Knowledge of who is affected and how is critical both in investigating customer reports of erroneous behavior and in proactively identifying customers affected by an issue.
Once you have identified which requests are driving performance problems, a good APM tool will give you the ability to trace the involved code, see how much time is being used by which parts, and understand how interactions with external services, cache, and databases contribute to the issues.
How can I optimize my operations to spend less money?
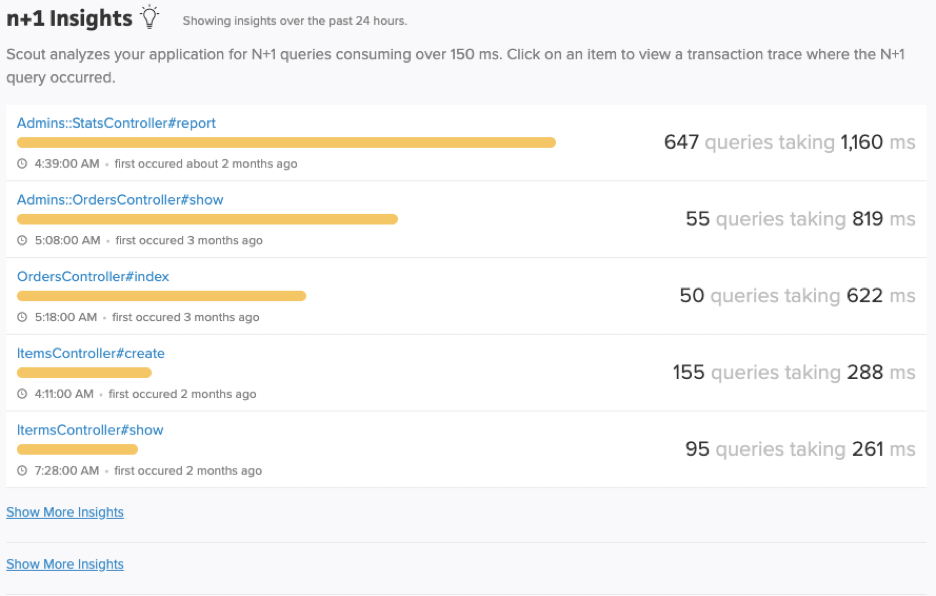
Most applications have a few areas that are run frequently and use the majority of resources and drive operational expenses. Once pinpointed these areas can often be optimized or augmented with caching solutions or higher performance datastores.
For high-volume applications, in particular, the visibility provided by APM tools can be transformative in reducing operating costs.

How long has this been happening? Who has been affected?
When a new problem shows up in your application it is important to understand the duration of the problem and how many customers have been affected. Good APM solutions include deploy tracking, so you can easily pinpoint exactly when an issue was introduced and filter requests to determine which customers may have been affected.
The ability to pinpoint when problems were introduced means you can either rectify the issue rapidly or roll back to a prior unaffected version of the application while your team works on a solution.
In addition, APM allows you to alert on undesirable application behavior. Your team will be notified so they can work on mitigation proactively, well before you hear complaints from customers.
What are my users doing: What are they struggling with? What do they like and want more of?
By thoughtfully instrumenting frontend and backend code with APM tools you can see the behavior of your users in real-time, allowing you to better understand things including:
- Which parts of your application users are using regularly?
- Do you have different groups of users with significantly different behavior?
- What errors are specific users seeing?
Customer experiences can make or break an application. Understanding how users really use your application gives you the context to prevent revenue loss and identify new opportunities for business growth.
Choosing the APM Tool That's Best for Your Business
There are a wide variety of APM solutions available, each with strengths and weaknesses. Before evaluating options it is a good idea to spend some time thinking about the specific needs of your business and applications to ensure a good fit.
Important criteria when exploring APM solutions include:
Quality of support for your preferred languages:
- Does the solution have rich support for the languages you are using?
- Are common libraries automatically detected and instrumented?
- Does the tool help you identify common issues and bottlenecks for your languages/frameworks?
Ability to segment requests:
- Can you find requests by user, by application instance, or by other dimensions that matter to you?
- Can you filter by custom criteria to find the requests you care about most quickly?
Code tracing capabilities:
- Can you easily visualize where your application is spending time during a request?
- Can you see how time is used interacting with external resources or between services?
Custom instrumentation:
- How easy is it to create custom events and traces in your preferred language?
- You will eventually outgrow built-in instrumentation for any solution so the ability to get visibility into application-specific logic easily is important.
Connecting application behavior to business outcomes:
- Can you visualize the key metrics that indicate business success or failure for each of your applications?
- When application behavior changes can you easily understand what the impact is for your business?
Best Practices for APM
To unlock the best results from any APM tool first consider your specific business goals: What does normal application behavior look like? What indicates real problems? What, if you could achieve it with your application, would mean you were succeeding?
Armed with this information, consider the following:
- Define your key Service Level Agreements (SLAs) and ensure you can visualize and alert on them
- Create alerts for meaningful shifts from application norms in request volume, latency, and error rates
- Pair APM with infrastructure monitoring so you can understand when changes in your applications are driven by changes in environment, rather than changes in code
- If your applications' resource usage can scale dynamically (common for cloud-based deployments), consider using your key APM metrics as triggers for your auto-scaling processes
- Last but certainly not least, ensure your engineers are aware of your APM tools and are comfortable using them to their full capability
What Gets Measured, Gets Managed
Companies rely on software to run key aspects of their businesses. Given this, it is important that applications are fast, efficient, and reliable. However many companies have little ability to understand how their applications are actually behaving.
Making decisions without clear information about how your software is working is a recipe for trouble. Customers are frustrated by slow, buggy interactions and critical business processes fail, sometimes without employees even knowing.
APM allows you to eliminate the guesswork and gives you deep insight into the software applications that run your business. Understanding the exact behavior of your applications empowers your and your team to locate defects quickly, improve availability, reduce costs, and serve customers in the ways they want to be served.

