Great news, Laravel friends! You can now monitor the performance of your Laravel apps with Honeybadger.
Yes, you read that right: Laravel performance monitoring in Honeybadger! Many of you have asked for this, and we're excited to tell you about it.
Earlier this year, we launched Honeybadger Insights, a new logging and performance monitoring tool bundled with Honeybadger. Insights allows you to query your logs and events to diagnose performance issues, perform root-cause analyses, and create charts and dashboards to see what's happening in real time. It also works automatically with Honeybadger’s best-in-class error tracking, unlocking direct access to query and analyze your error data.
Today, we’re turning Insights up a notch with two new features just for Laravel developers:
- A new Laravel performance dashboard. Instead of creating a dashboard from scratch, select “ Laravel” from our list of curated monitoring dashboards. The new dashboard allows you to monitor requests and background jobs, slow requests and queries, and more.
- Laravel performance instrumentation. Our composer package now automatically sends performance events and metrics from Laravel. The new instrumentation is what powers your dashboard, but you can also use our query language—BadgerQL—to dig into the data yourself.
The Laravel Performance Dashboard
When creating a dashboard in Honeybadger, you have several options. To get started, select the new “ Laravel” dashboard from the list:
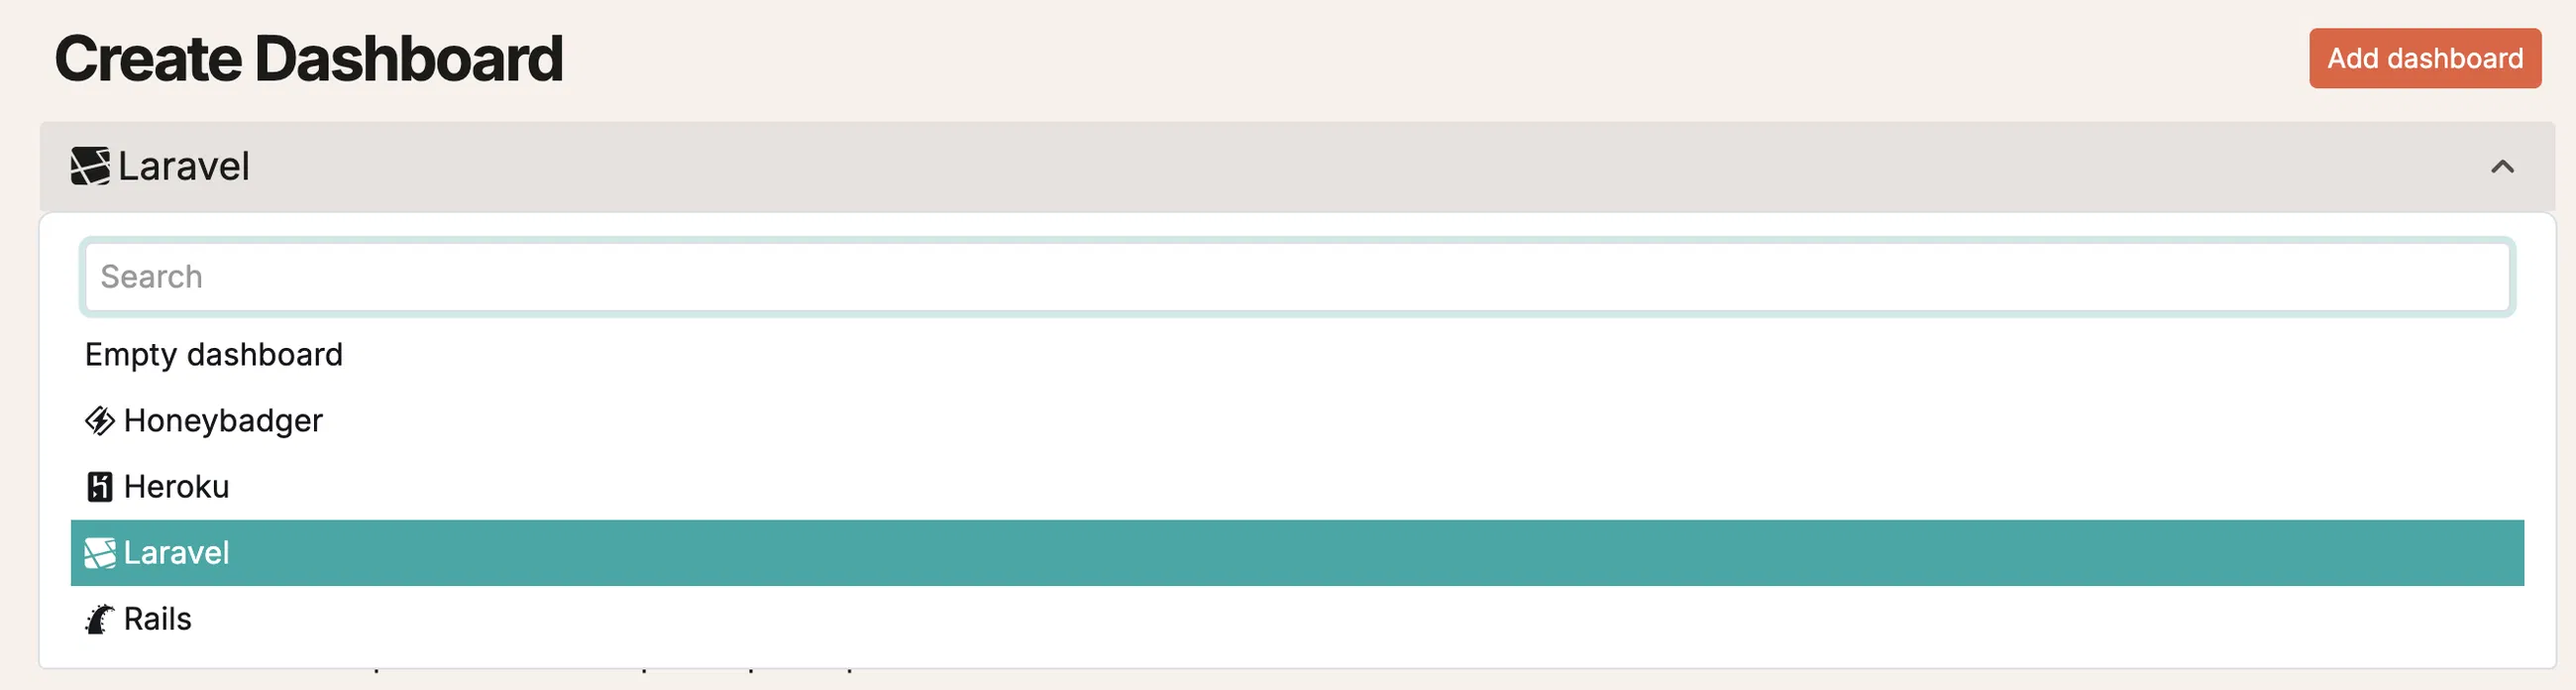
Our team curates each dashboard to make it easy for you to ramp up with Honeybadger and BadgerQL. Install a monitoring integration (such as our composer package), select the matching dashboard, and you're done.
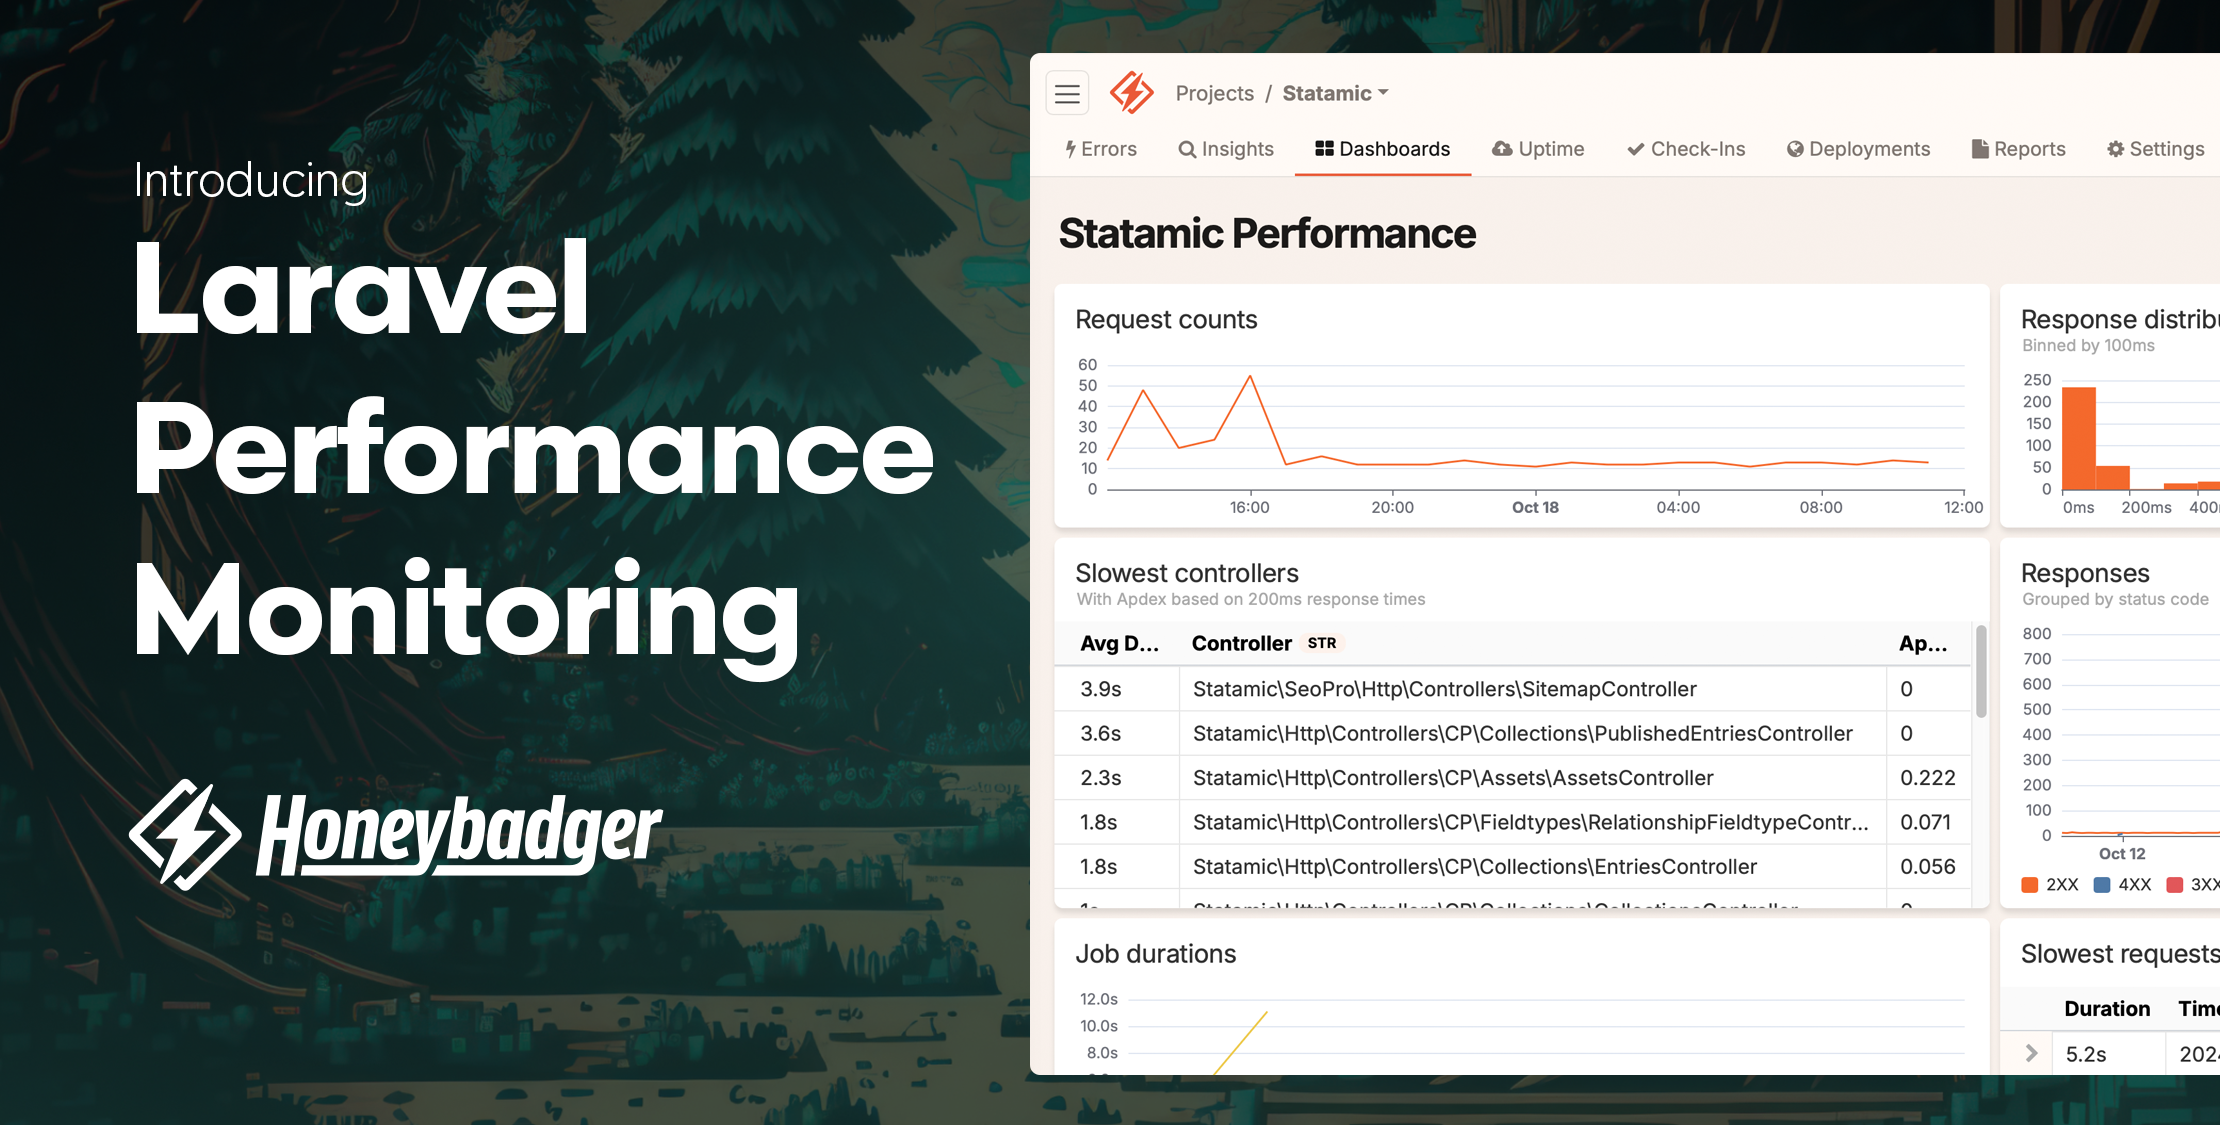
We recently deployed a production Laravel app at Honeybadger (Statamic, it’s fantastic!). Here’s what our dashboard looks like:
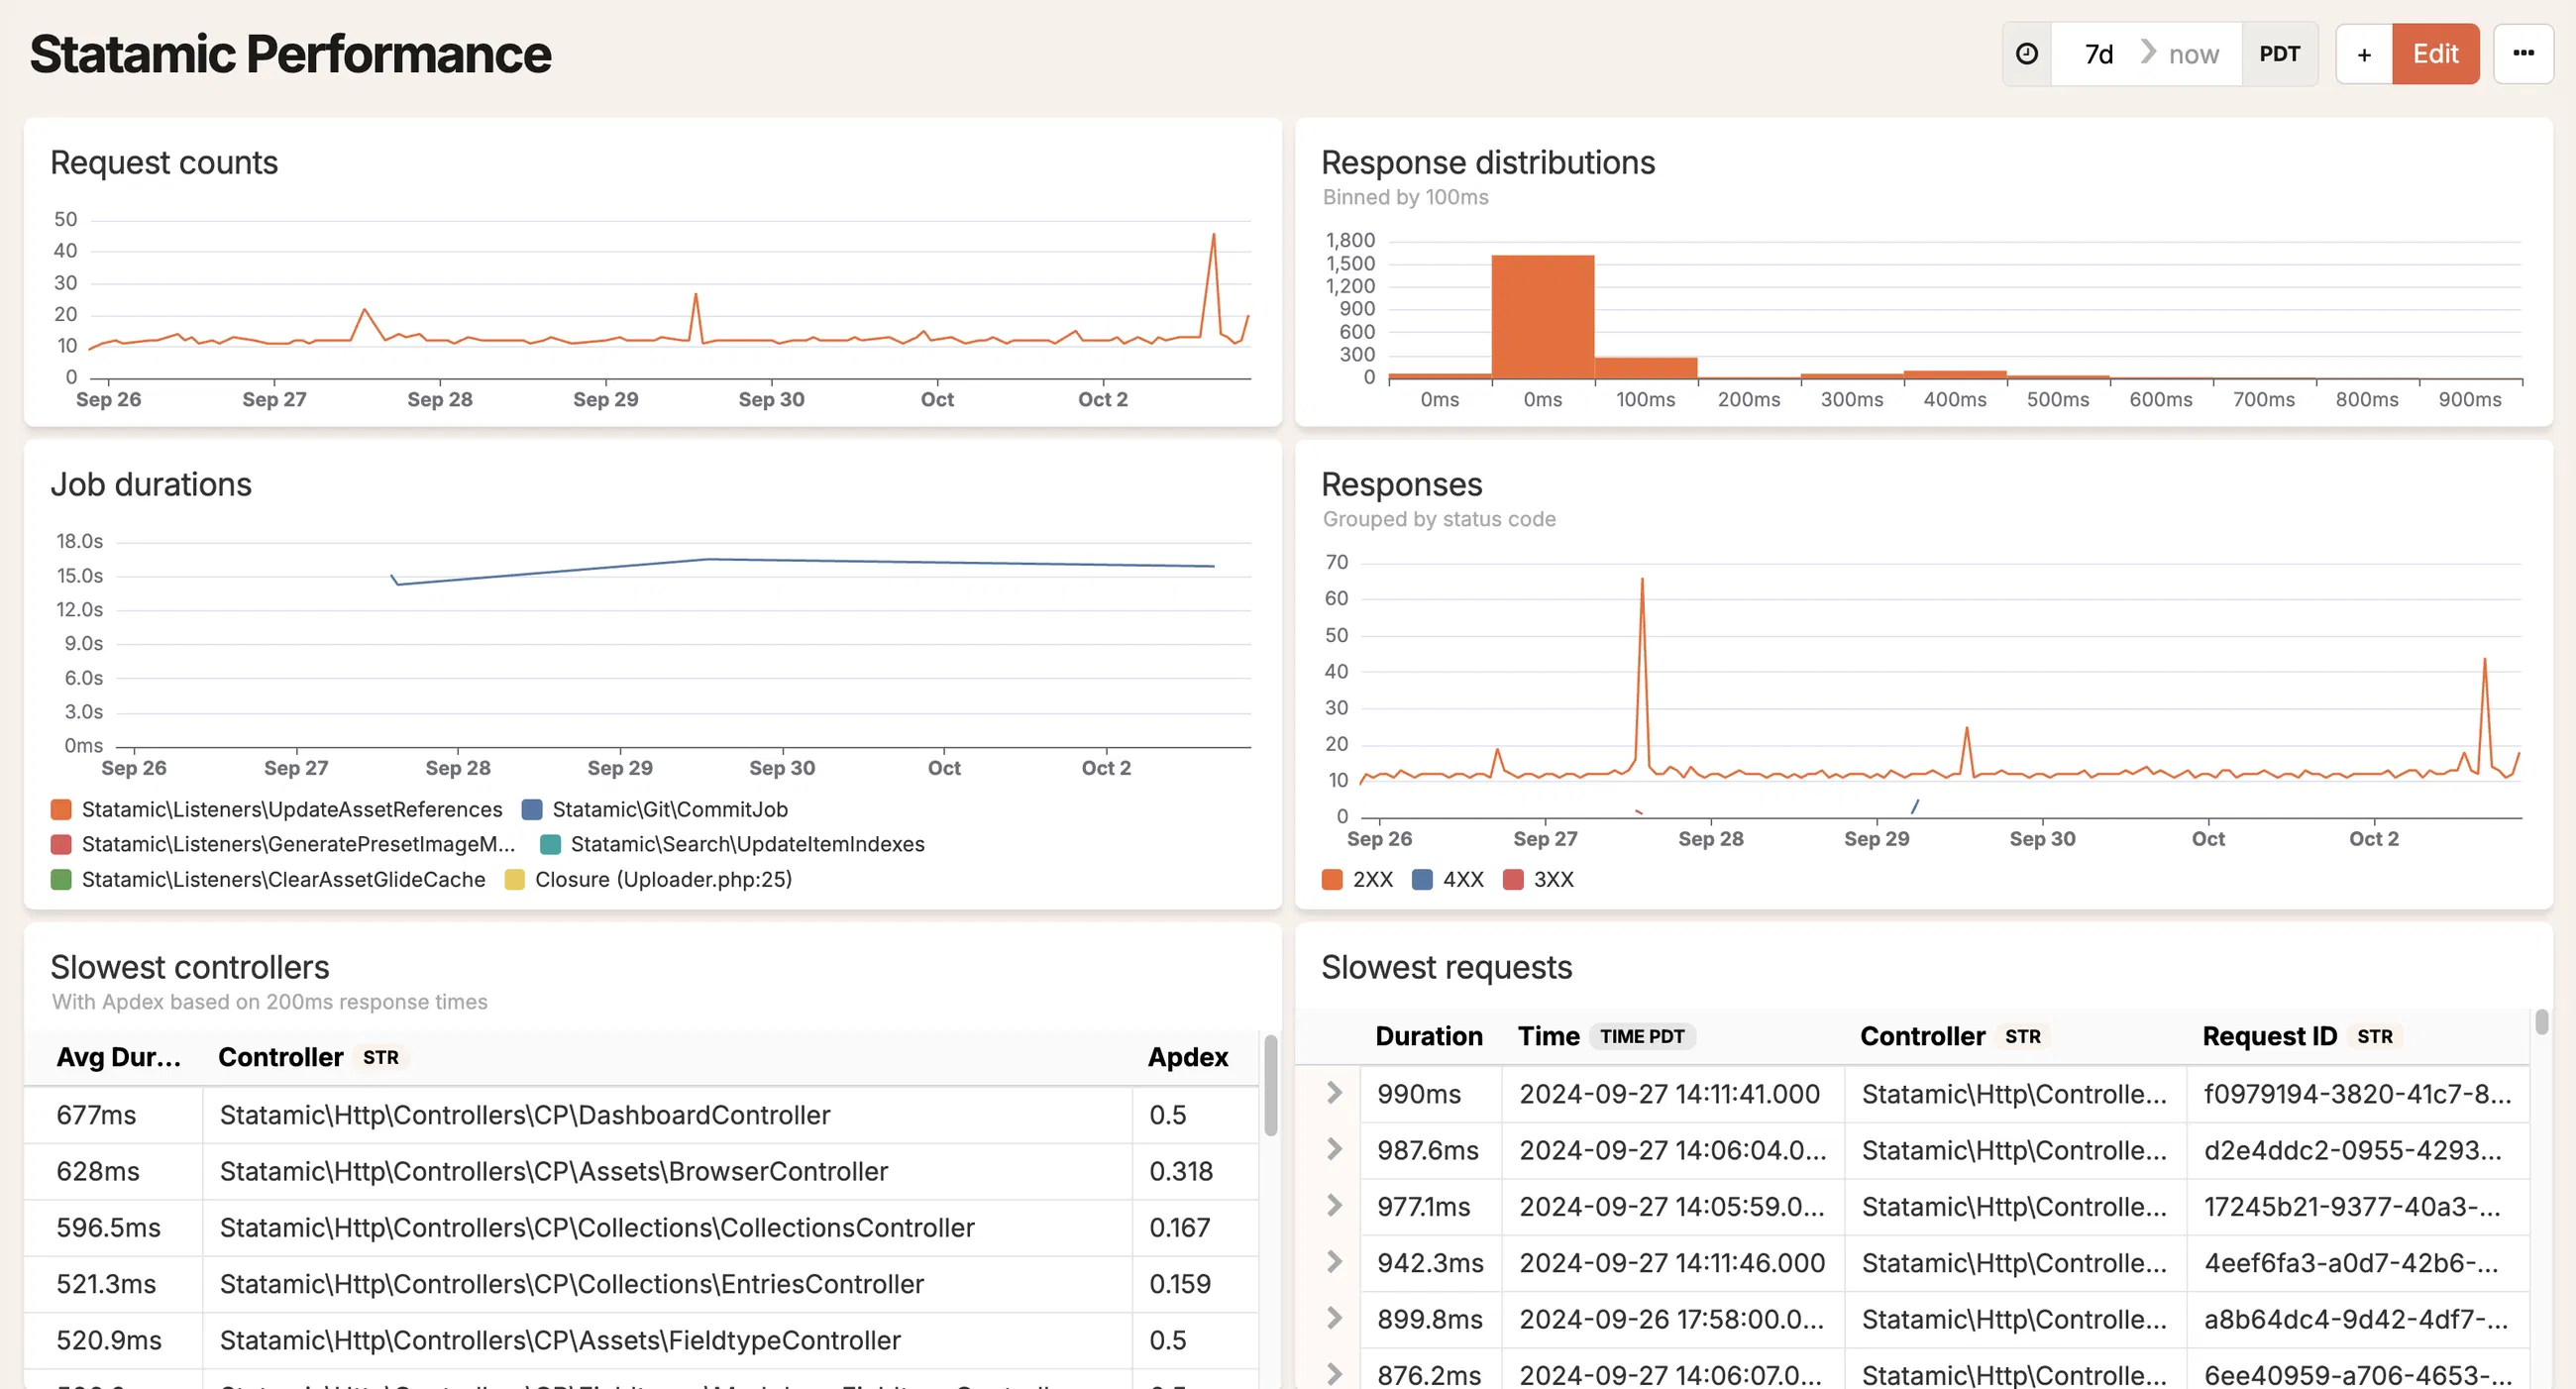 Honeybadger’s new Laravel Performance Dashboard
The new Laravel dashboard includes the following widgets by default:
- Request counts — A line chart of the number of requests to your Laravel app over time. Know immediately when you have a spike and when traffic is steady.
- Response distributions — A bar chart that shows the response distributions binned by 100ms. See how a majority of your requests are performing.
- Job durations — A line chart showing the average duration for each of your Laravel jobs. Helps you keep the processing pipeline optimized.
- Responses — A line chart showing the number of responses grouped by status code. Are you having a spike in 403 Forbidden responses? This chart will tell you about it.
- Slowest controllers — Your slowest Laravel controllers, with Apdex scores based on 200ms response times. This table tells you where you can improve performance.
- Slowest 10 requests — Your slowest requests by controller and duration. Use the included
Request IDto query for events that happened during that request (such as a slow SQL query, N+1 queries, etc.). - Slowest queries per request — Quickly see your slowest queries, including the average & max duration per
Request ID. - Slowest 10 outgoing requests — Your slowest outgoing requests, like when you call an external REST API.
- Slowest 10 queries — Your slowest SQL queries overall.
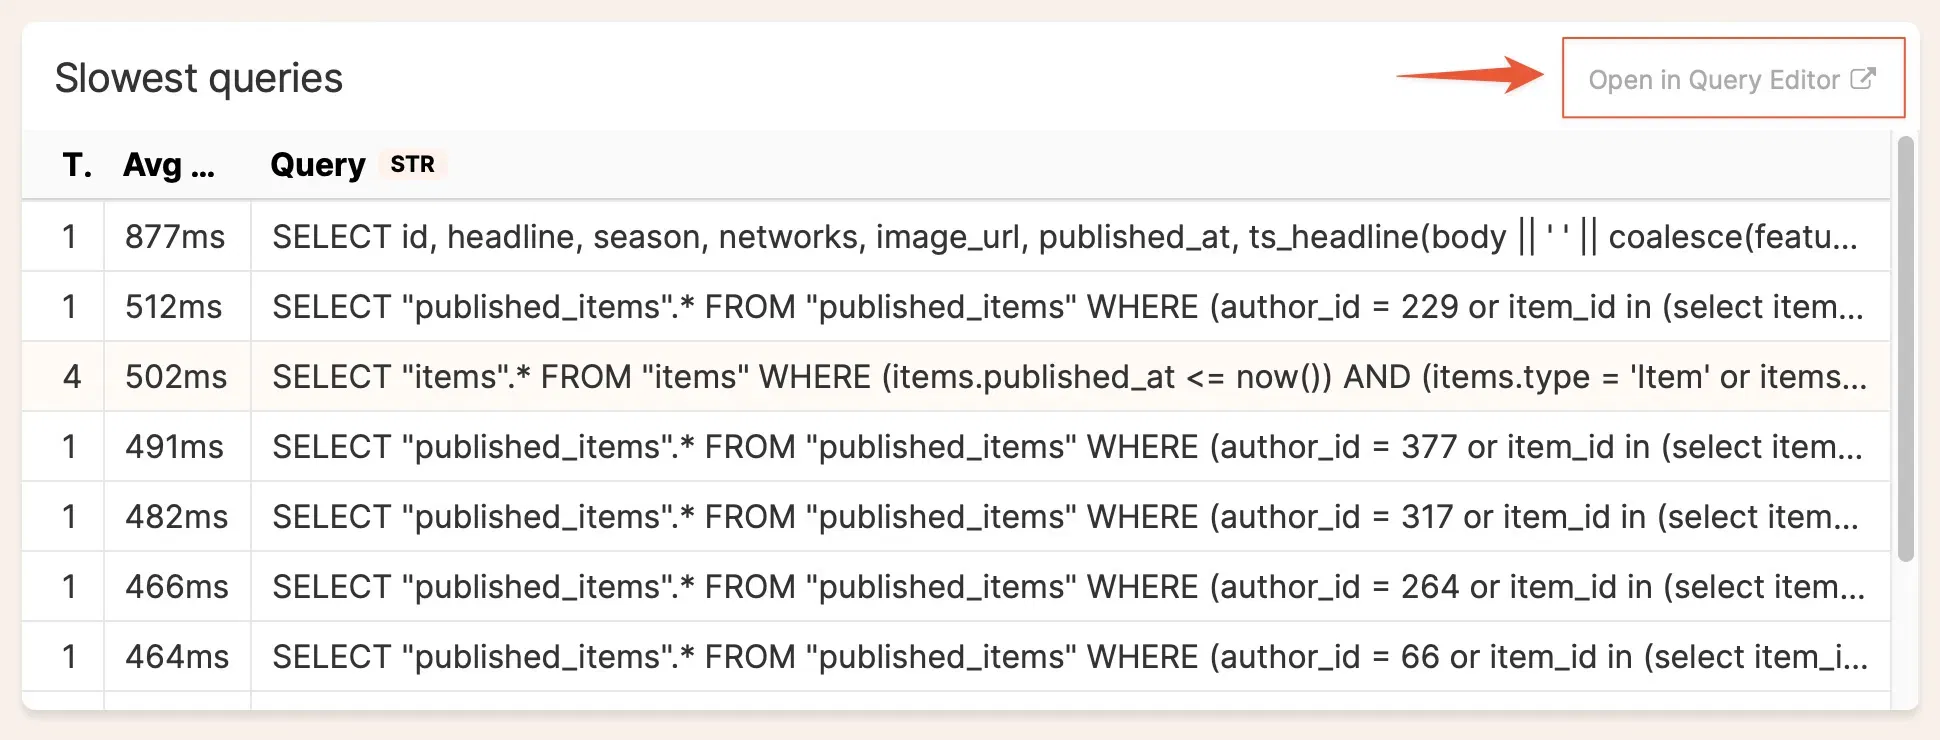
After you create a dashboard, you don't have to keep the default widgets—we designed Honeybadger dashboards to be customized. In fact, reading the underlying queries is a great way to learn BadgerQL. To see the query and raw data behind any dashboard widget, click "Open in Query Editor":
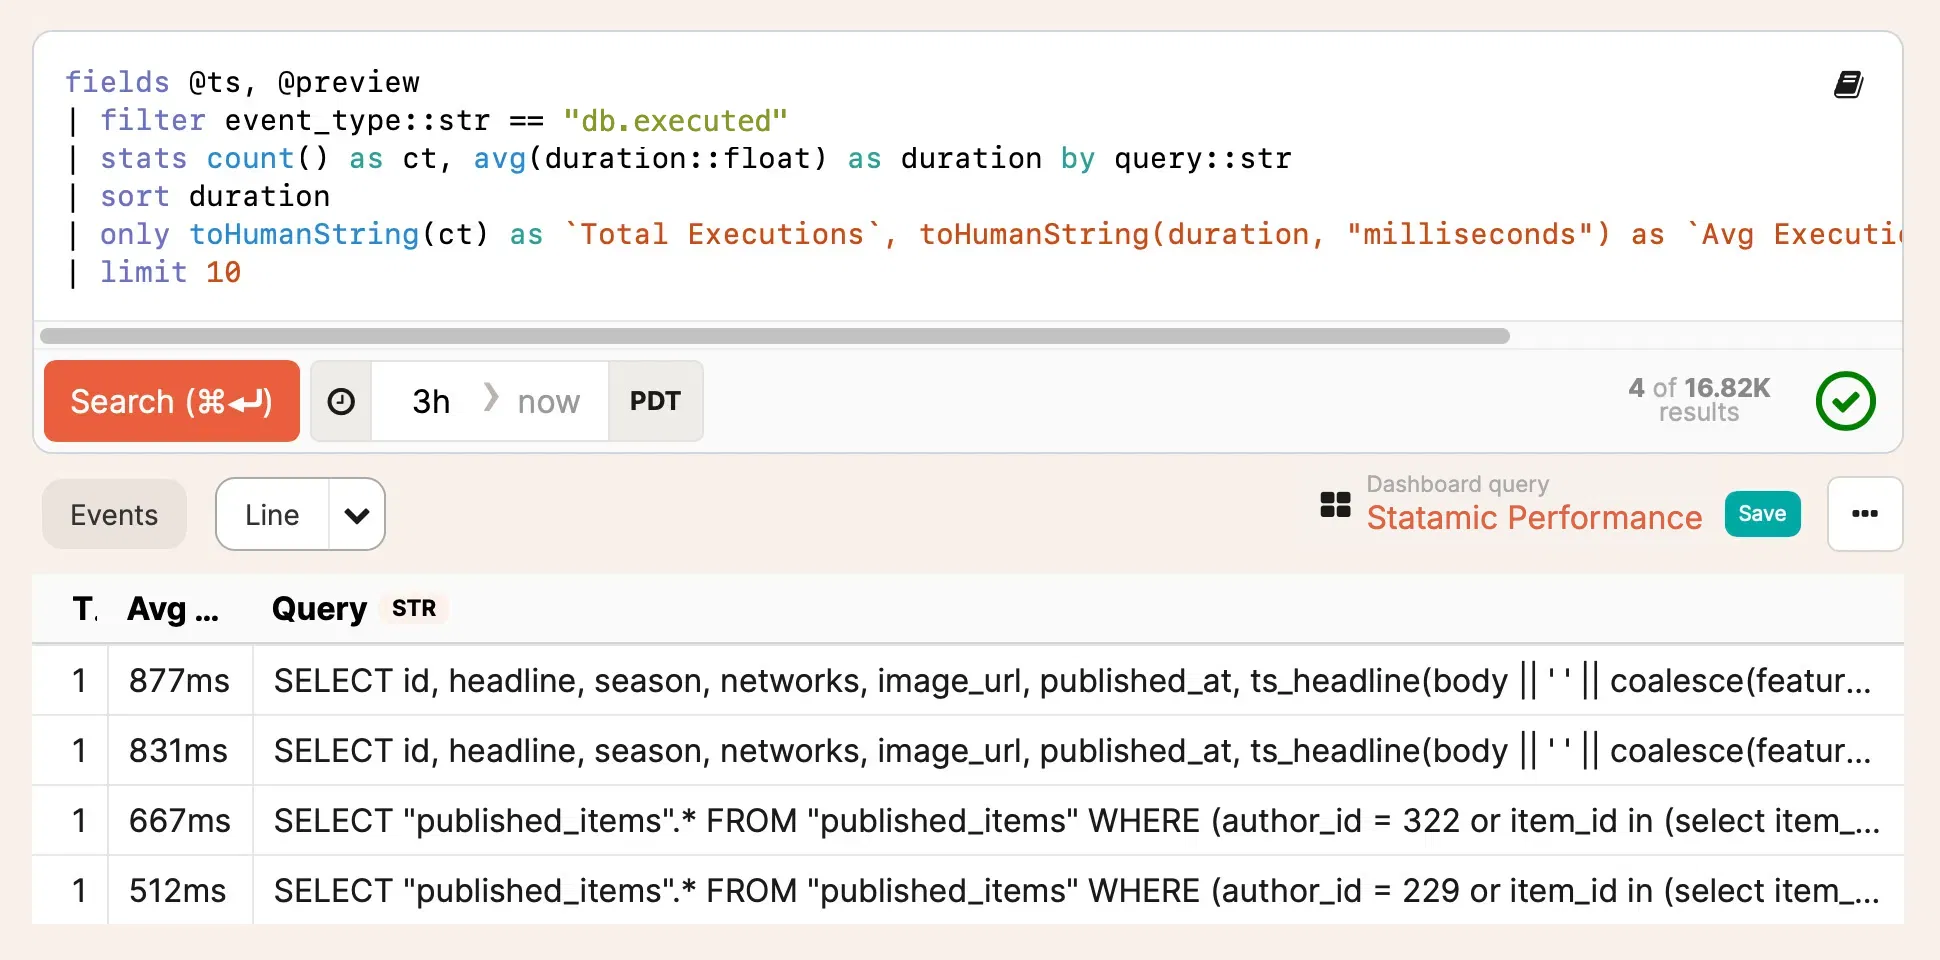
 You can tweak the query, review the results, and update the dashboard from there:
Laravel performance instrumentation
The data that feeds the new Laravel Dashboard is sent automatically from the honeybadger-laravel composer package starting in version 4.2.x—so make sure you upgrade to the latest version. After you upgrade, you'll also need to enable the Honeybadger Insights instrumentation for Laravel by adding the following to your config/honeybadger.php config file:
'events' => [ 'enabled' => true]We'll enable this feature by default in a future package version, but you must opt in for now. After deploying the new Laravel config, some new events and metrics will begin to appear in Honeybadger Insights, and your Laravel dashboard will come alive!
We also added some new configuration and documentation to help you customize the events you care about. To learn more, check out our new Sending Events to Insights guide.
Sending custom events
You can also send your own Laravel events to Honeybadger using the Honeybadger.event method:
Honeybadger.event('user_activity', [ 'action' => 'registration', 'user_id' => 123])The first argument is the type of the event (event_type), and the second argument is an object containing any additional data you want to include.
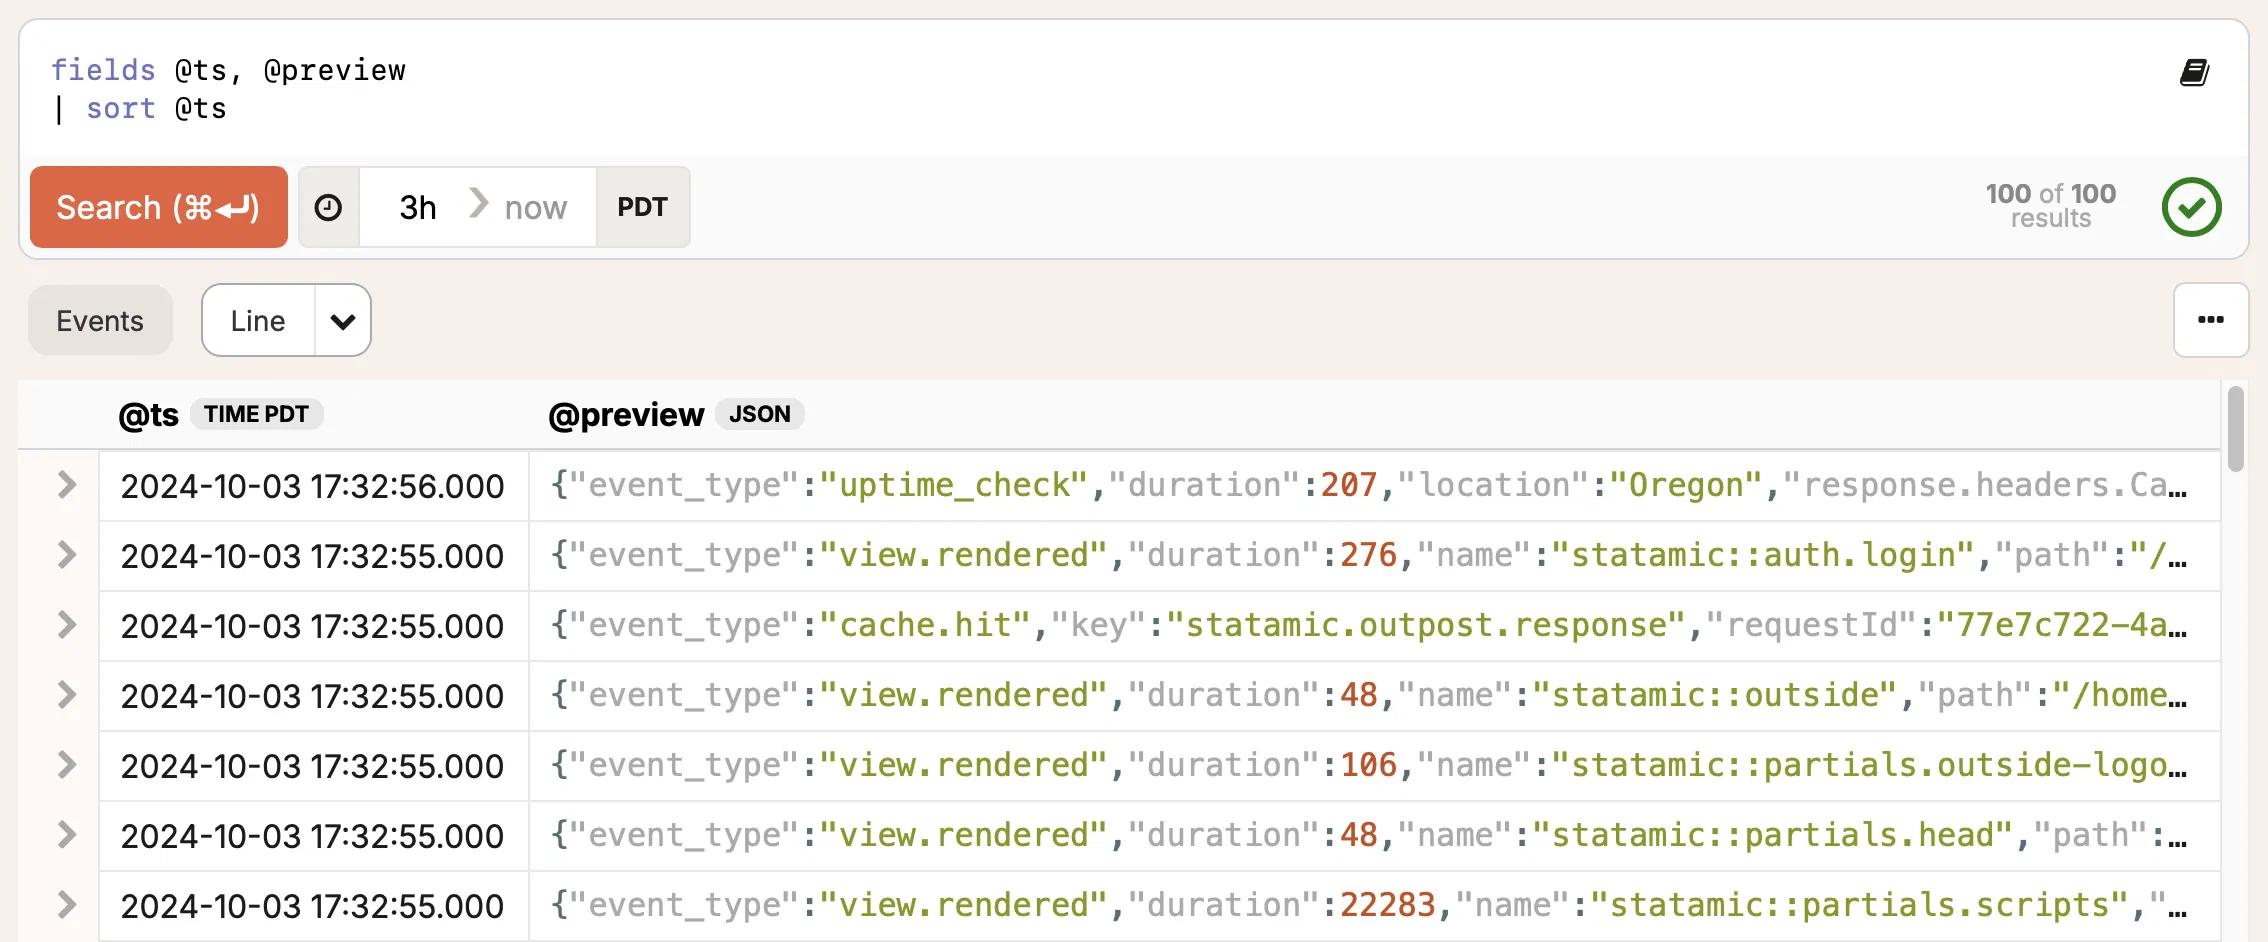
You can find these events with the following BadgerQL query:
fields @ts, @preview| filter event_type::str == "user_activity"| filter action::str == "registration"| sort @tsSending your Laravel application logs
Honeybadger’s approach to logging is “Log everything, ask anything.” You don’t always know what information will be helpful when you’re troubleshooting an outage (or an error). In addition to the performance telemetry that we now record by default, you can send your Laravel application logs to Honeybadger.
There are several ways to do this:
- Send your logs from your infrastructure (i.e., your server, Docker containers, etc.)
- Use our Monolog handler
- Use our Laravel channel driver
Using our channel driver is the simplest way to get started in Laravel. To configure it, add our event driver to your config/logging.php config file:
'channels' => [ 'stack' => [ 'driver' => 'stack', 'channels' => ['single', 'honeybadger'], 'ignore_exceptions' => false, ], 'honeybadger' => [ 'driver' => 'custom', 'via' => Honeybadger\HoneybadgerLaravel\HoneybadgerLogEventDriver::class, 'name' => 'honeybadger', 'level' => 'info', ],],Now you can write log messages as usual with Laravel's log facade, and they'll show up in Honeybadger:
Log::info('An info message');Log::error('An error message with context', ["some-key" => "some-value"]);And, of course, this also works for Lumen!
Laravel performance monitoring in Honeybadger
To try out the new Laravel performance monitoring features in Honeybadger, all you need to do is sign up for a free Honeybadger account. We include 50MB/day (1.5GB/month) ingest for free, and you can upgrade to a paid plan if you need more. Our pricing is reasonable, too! Honeybadger is almost 8 times cheaper than Papertrail for logging. 🤯
Whew! That was a lot to get through, and we’re just scratching the surface of our roadmap for performance monitoring in Laravel. Questions or comments? Schedule a call with us to learn how Honeybadger can help streamline your monitoring stack and your costs.

Joshua Wood is a software developer and the co-founder of Honeybadger.io — the full-stack web application monitoring tool for developers.