Sentry is a popular error and application performance monitoring platform that can be easily integrated into a Laravel application to help you identify and fix performance issues quickly. With Sentry, you can capture errors, crashes, and performance problems that occur within your application and receive alerts to take immediate action.
In this post, we will cover how to install and set up Sentry in a Laravel application, as well as how to explore some of Sentry's features that are valuable for improving application performance.
How to install & set up Sentry in a Laravel Application
Getting started with Sentry takes just 5 lines of code - no agents required. Sentry's automatic instrumentation captures transactions and spans, making it easier to trace the root cause of any issues that occur within your application.
To get started with monitoring your Laravel application, install the sentry/sentry-laravel package with Composer:
composer `require sentry/sentry-laravelThen, add Sentry reporting to App/Exceptions/Handler.php
public function register(): void{ $this->reportable(function (Throwable $e) { \Sentry\Laravel\Integration::captureUnhandledException($e); });}Lastly, run this Artisan command to configure the Sentry DSN:
php artisan sentry:publish --dsn=<paste-your-DSN-here>Check out the documentation for the latest instructions. Now, in order to activate Sentry's performance monitoring, you'll want to configure your sample rate for transactions by either:
- Setting a uniform sample rate for all transactions using the traces_sample_rate option in your SDK config to a number between 0 and 1. (For example, to send 20% of transactions, set traces_sample_rate to 0.2.)
- Controlling the sample rate based on the transaction itself and the context in which it's captured, by providing a function to the traces_sampler config option.
These two options are meant to be mutually exclusive. If you set both, traces_sampler will take precedence.
// Specify a fixed sample rate:'traces_sample_rate' => 0.2,// Or provide a custom sampler:'traces_sampler' => function (\Sentry\Tracing\SamplingContext $context): float { // return a number between 0 and 1},While you're testing, set traces_sample_rate to 1.0, as that ensures that every transaction will be sent directly to Sentry.
Once testing is complete, we recommend lowering this value in production by either lowering your traces_sample_rate value, or switching to using traces_sampler to dynamically sample and filter your transactions.
And that's it! See this documentation for more tips on how to improve the response time of your PHP application.
Use Sentry to detect performance issues
If left untreated, performance issues can fester and grow into full-blown errors. Taking action (before it's too late) is easy in Sentry — you can triage, assign, and resolve performance issues directly from your issues feed.
Sentry alerts you on latency issues in your application that you can actually fix - no deciphering dashboards or researching span trees required.
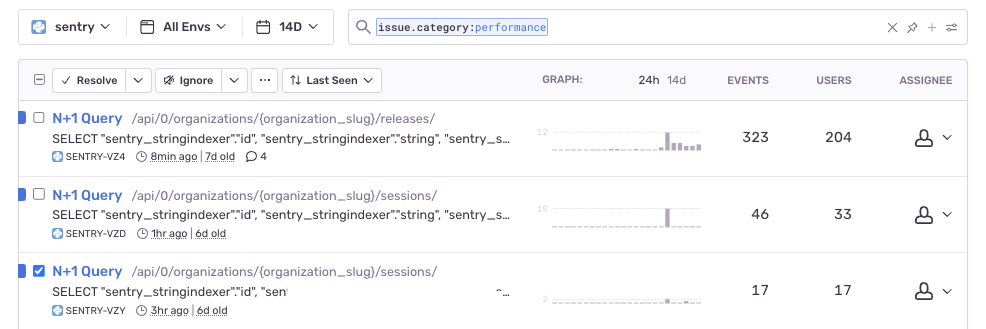
Sentry detects a number of backend performance issues like N+1 database queries, consecutive database queries, and slow database queries. With Sentry, you can:
- Get notified about your performance issues via email or one of your favorite workflow tools like Slack, Pagerduty, or Jira.
- See the most relevant spans in a condensed span tree to find the root cause faster in your code (similar to a stack trace for error issues. You can also expand the span waterfall to see more of your issue evidence.
- Triage, assign, and resolve issues directly in your issues feed.
Instead of manually monitoring transactions over time, you can let Sentry tell you exactly what's wrong in your code in order to quickly take action.
Understand your overall application health
In addition to alerting users on specific performance issues, Sentry provides detailed information about slow transactions, database queries, and HTTP requests in a transaction summary. This provides a high-level overview of the performance metrics you care about — whether it's a p95 duration or failure rate of your transactions.
You can also decrease troubleshooting and manual searching through logs with suspect spans that make it easier to find slow requests that are impacting your users the most.
To get a holistic view of your application health, you can also create custom dashboards to align on performance KPIs that your team deems business-critical, plus see any trends that indicate significant changes in performance over time in your application.
The benefits of using Sentry for Laravel application monitoring
Connect Backend and Frontend Issues
Sentry's distributed tracing allows for seamless connection between backend and frontend issues, enabling developers to effectively monitor and diagnose problems in their applications.
You can trace slow-loading pages all the way back to poor-performing API calls — and surface any related errors — to get to the root cause of a performance issue faster.
If you use Sentry Performance on your Javascript projects, you can also connect traces for complete visibility. You can do this
- For requests that start in your backend, by adding a meta tag in your HTML template that contains tracing information.
- For requests that start in JavaScript, by the SDK setting a header on requests to your backend.
Profiling for Code-Level Insights
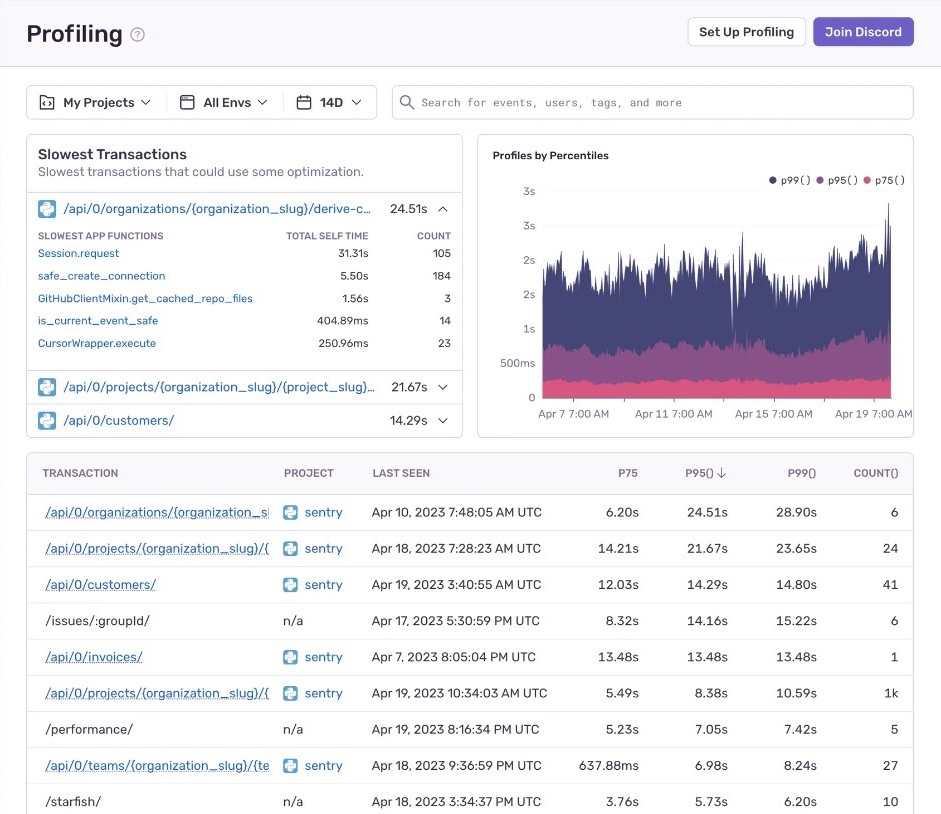
Sentry's latest feature, Profiling, gives code-level insight into performance bottlenecks in production – allowing you to speed up troubleshooting and optimize resource consumption. It is now available for PHP, Python, Node, Android, and iOS users.
Profiling allows you to:
- Drill into the exact functions and lines of code, causing a latency issue without writing performance tests or searching through spans.
- Optimize resource consumption by using flamecharts to identify hot code paths before users feel the impact of a slow request.
- Test your application performance in any environment, including in production, with minimal overhead.
- Fill missing instrumentation gaps with insights into your code execution - no need to manually add in spans.
Improve your Laravel application with performance monitoring
Sentry is a powerful tool that can help you improve your Laravel application by identifying issues quickly. By following the steps outlined in this post and exploring some of Sentry's features, you can ensure that your Laravel application is performing at its best and delivering a great experience from beginning to end for your users.


