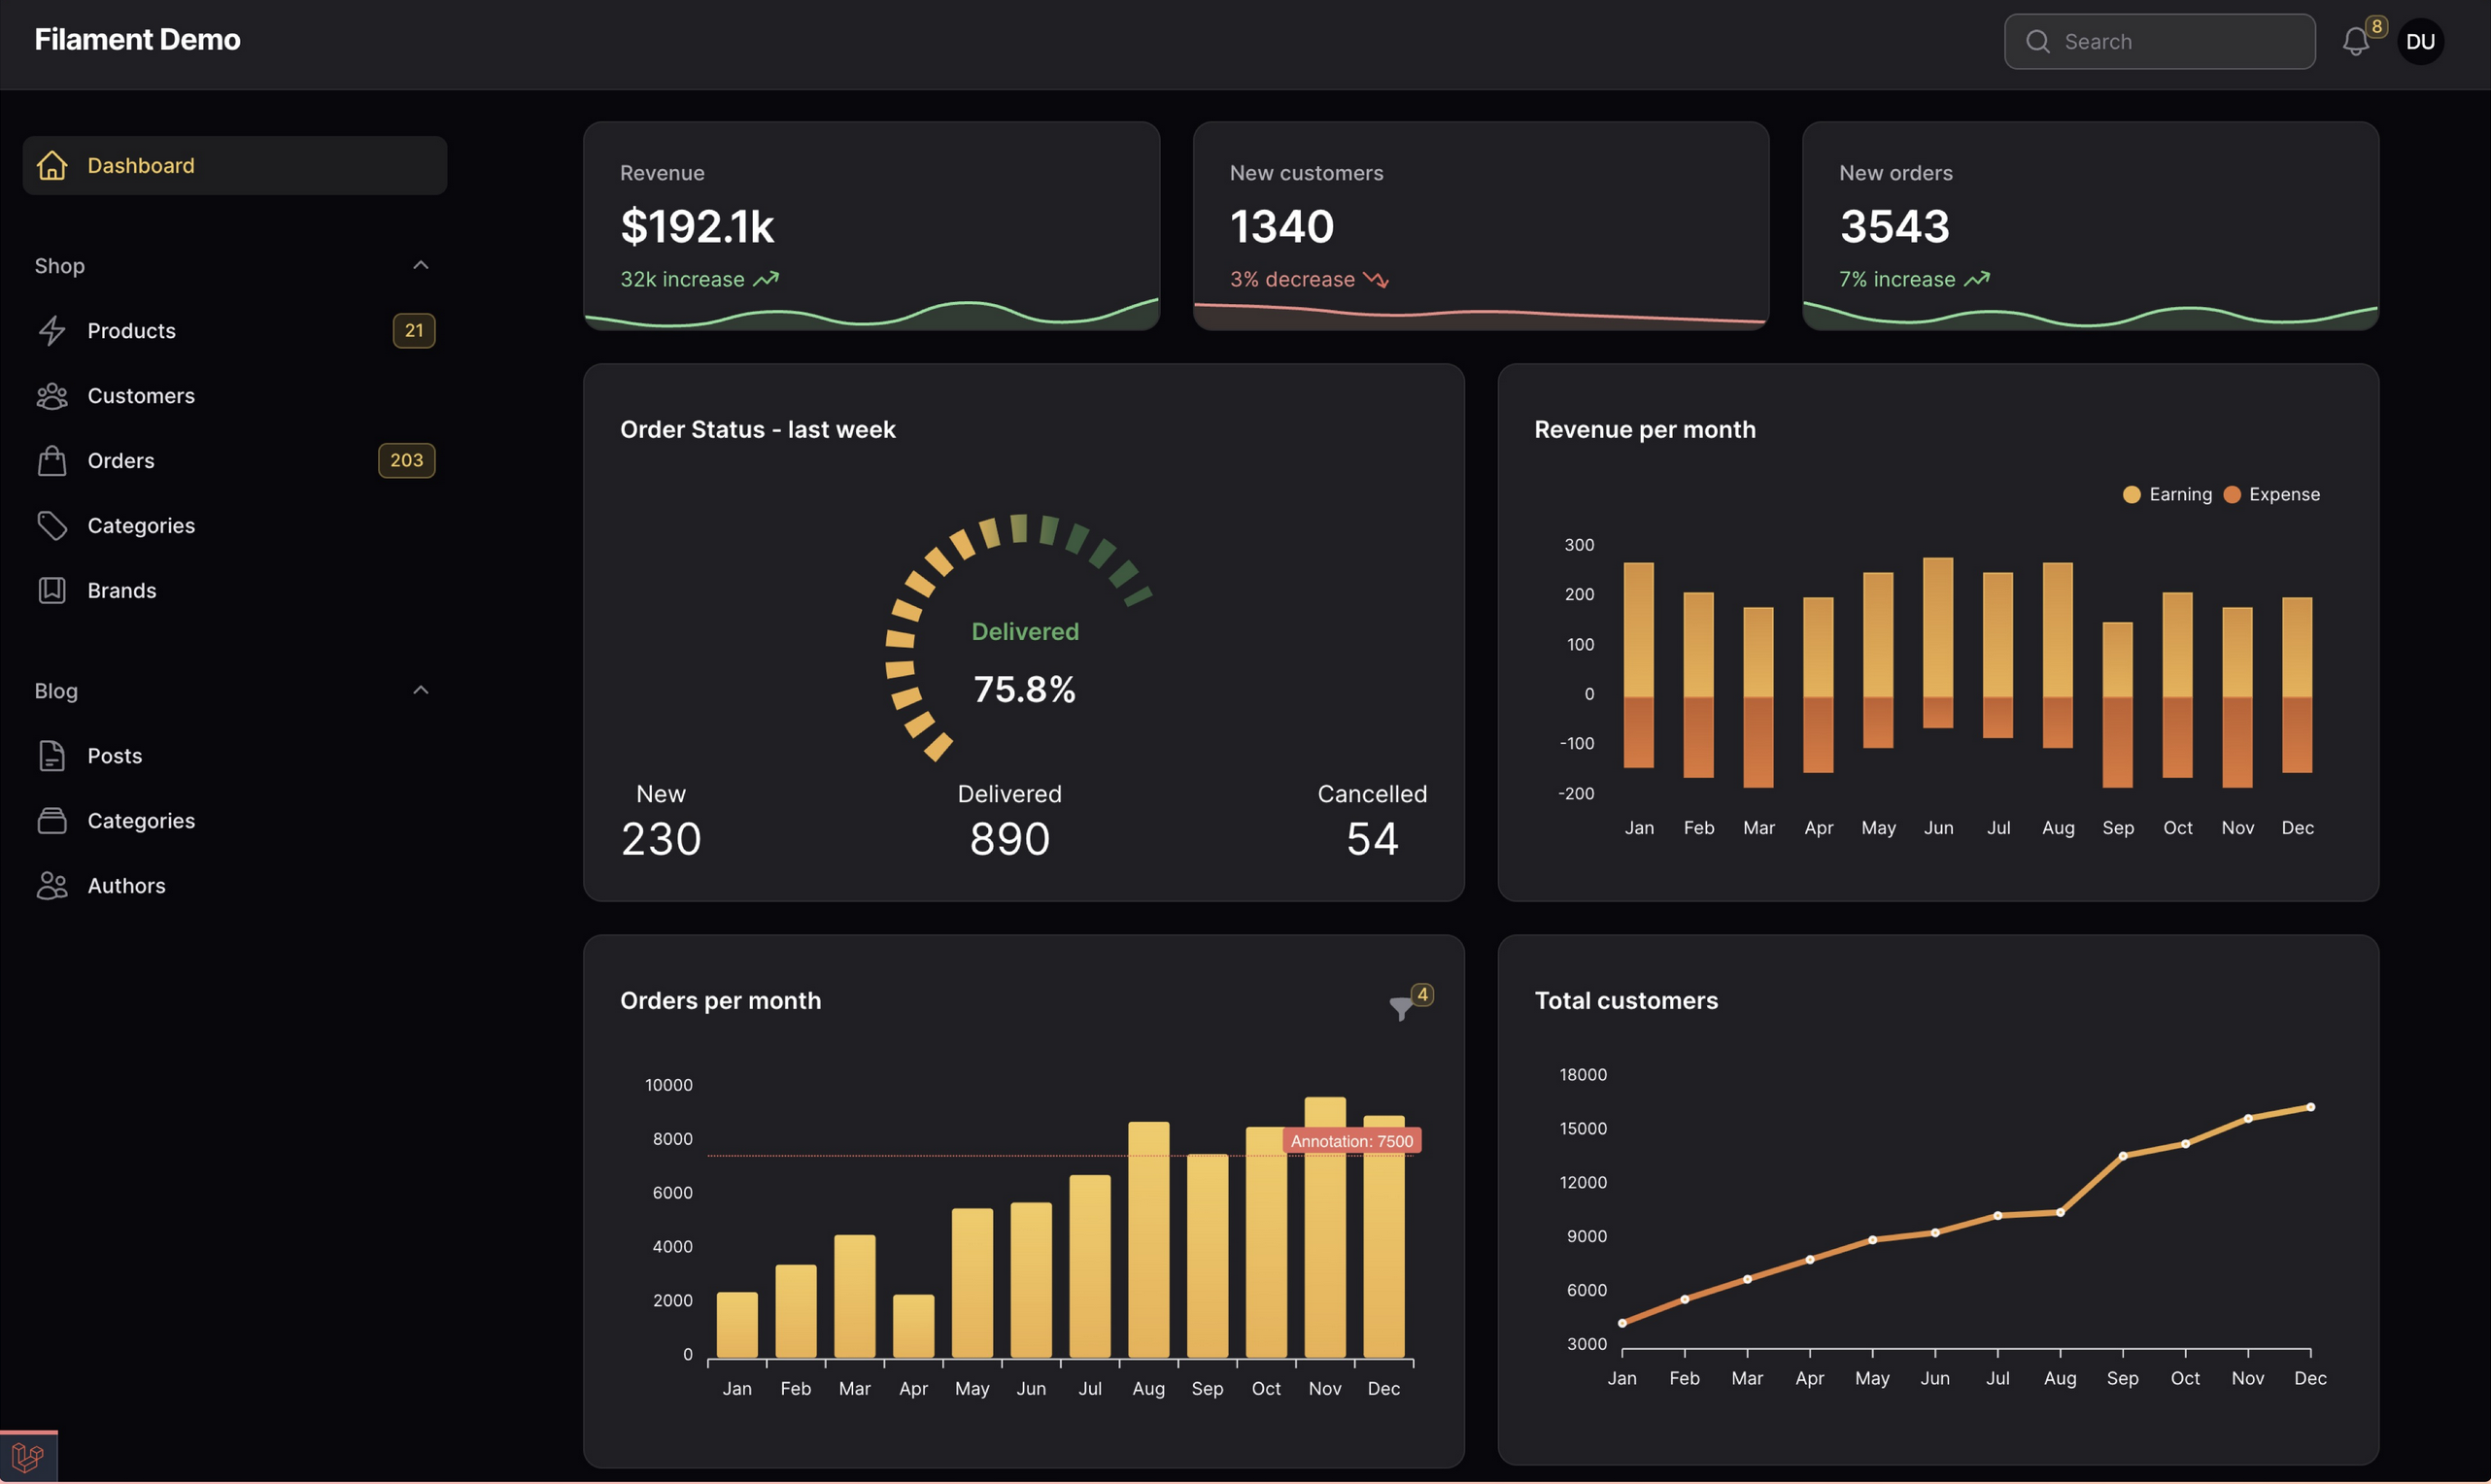
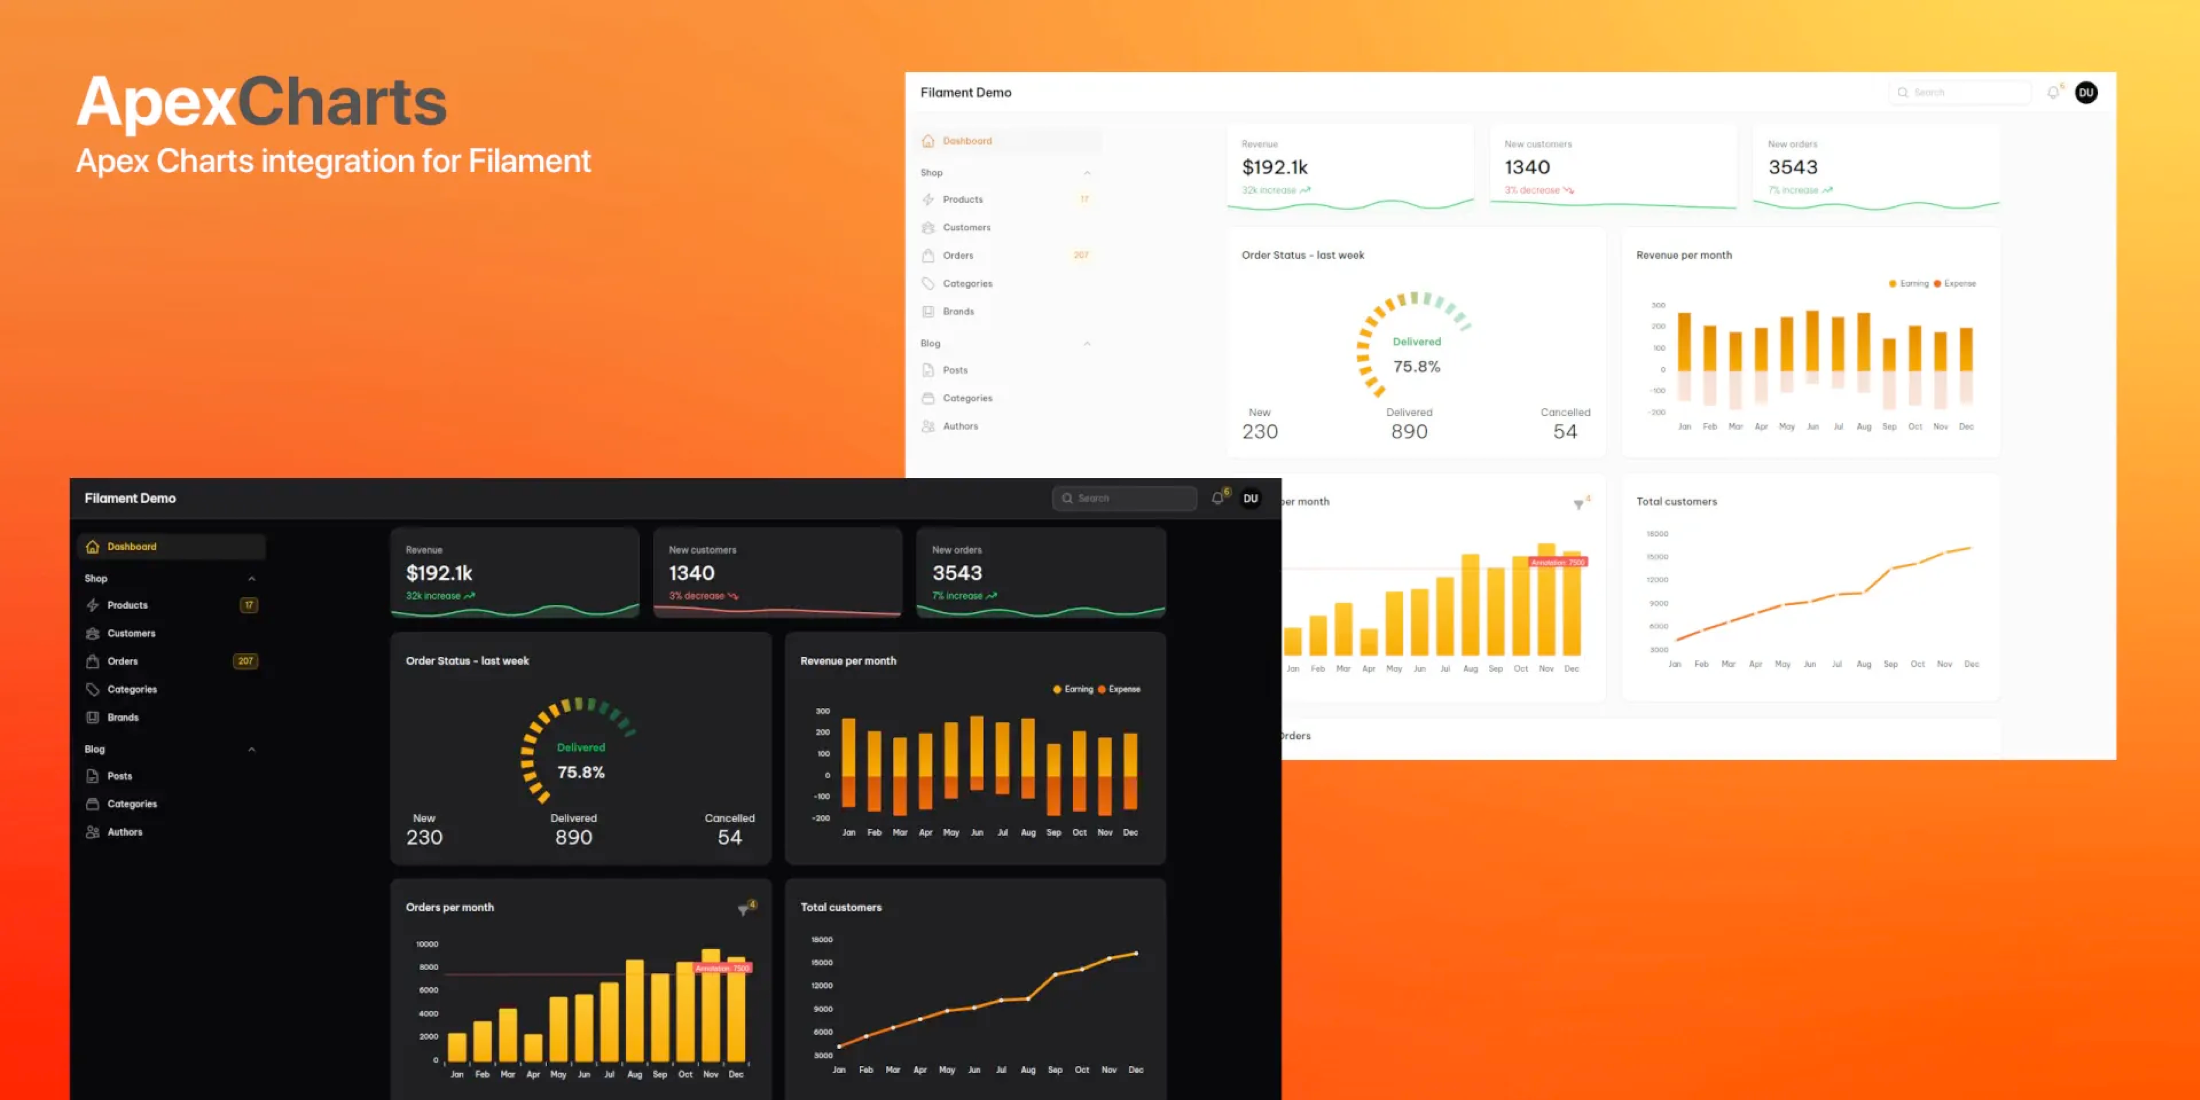
The Apex Charts plugin for Filament by Leandro Ferreira brings the popular Apex Chart library to your Laravel applications. This plugin uses the same API as the Apex Chart library, so you can use the official documentation as a configuration reference for creating a chart in Filament as you would for the JS library.

This package also supports filtering widget data, live updating (polling), deferred loading, loading indicator, dark mode, and more. The plugin supports a ton of charts through Apex, which you can see by setting up the demo application:
- Area
- Bar
- Boxplot
- Bubble
- Candlestick
- Column
- Donut
- Heatmap
- Line
- Mixed-LineAndColumn
- Pie
- PolarArea
- Radar
- Radialbar
- RangeArea
- Scatter
- TimelineRangeBars
- Treemap
- Funnel
To start with this plugin in your Filament project, check out the plugin page. The Apex Charts documentation is another excellent resource to see the full list of configuration options for your charts.


