Inertia DevTools is now available on the Chrome Web Store. The extension adds an "Inertia" panel to Chrome DevTools that records every Inertia visit and shows what it sent and received.
What the Panel Shows
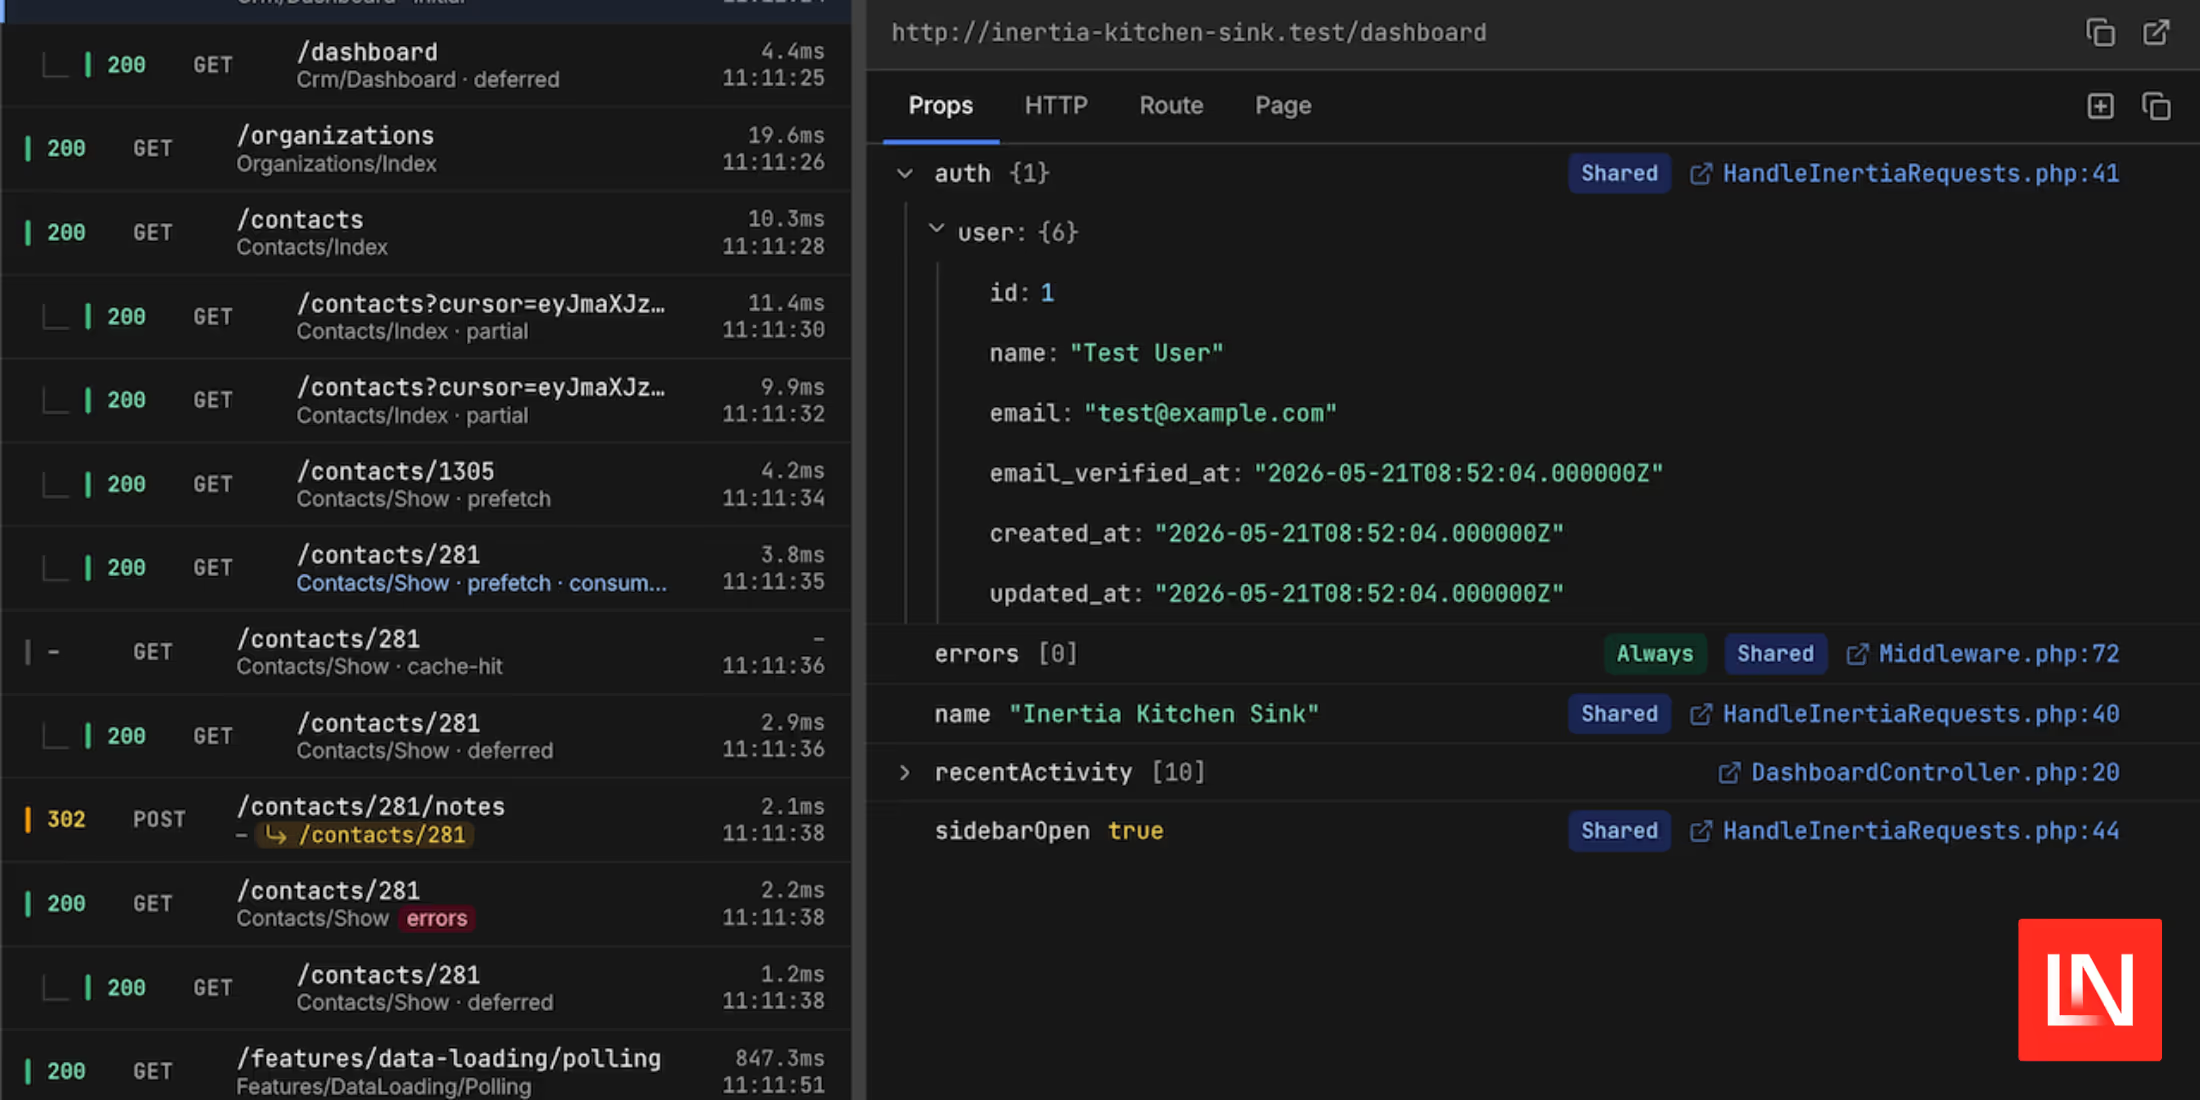
Requests are listed in a timeline down the left side, with a live indicator while one is in flight. You can filter by method, request type, or status, and search across URLs and components. Related requests are grouped together, so a visit and its follow-up partial reloads, deferred loads, polls, prefetches, and Precognition validation requests stay in one entry rather than scattering down the list.
Selecting a request opens four tabs:
- Props lists every prop as a tree, with badges marking deferred, optional, merged, and shared props.
- HTTP shows the request and response headers and bodies.
- Route shows the matched route name, URI, and controller action.
- Page shows the full page state after Inertia has handled the response, including data merged in from partial reloads.
File references throughout the panel link into your editor. The toolbar has a picker with VS Code, PhpStorm, Cursor, and Zed supported out of the box. Sublime Text needs a URL scheme handler such as SublimeUrl.
Client-Side Events
Some interactions never reach the server, which is why the Network tab shows nothing for them. Client-side visits and requests served from the prefetch cache are recorded as their own timeline entries, so a navigation that resolved from cache still shows up as something you can inspect.
Recorded Data Stays Local
Entries are written to storage/inertia-devtools and pruned automatically, with retention, limits, and the path configurable under devtools.storage in config/inertia.php. Nothing is sent to a remote service.
Sensitive prop keys and headers are redacted before an entry is stored, so values such as passwords, tokens, and authorization headers never reach the panel. The redacted keys are configurable under devtools.redact. Common tooling routes like Telescope and Horizon are excluded from recording.
Getting Started
There is no package to install. The recorder ships inside the libraries you already have, so you need the client-side adapter at ^3.6 and the Laravel adapter at ^3.2. Install the extension, open Chrome DevTools, and select the "Inertia" panel. Run the Vite development server for full functionality.
See the Inertia Devtools documentation for complete setup and usage instructions. The extension source is on GitHub under the MIT license.