Livewire Charts is a package by Andrés Santibáñez for creating neat charts using Livewire in Laravel projects.
Just released livewire-charts v1.0.0
Add @LaravelLivewire + @Alpine_JS + @apexcharts powered charts to your projects.
Check it out here! https://t.co/3hMiuYbGTG
I've also added a demo repo with examples. https://t.co/v9bK7Gyf2g
Enjoy!
Feedback welcomed! pic.twitter.com/VoAce6U0O3
— Andrés Santibáñez (@asantibanez) October 19, 2020
This package uses the following technologies (required) to generate Livewire charts:
- Laravel Livewire v2
- Alpine JS
- Apex Charts
Once you have those requirements installed and set up, here’s how easy it can be to create a chart with this package on the backend:
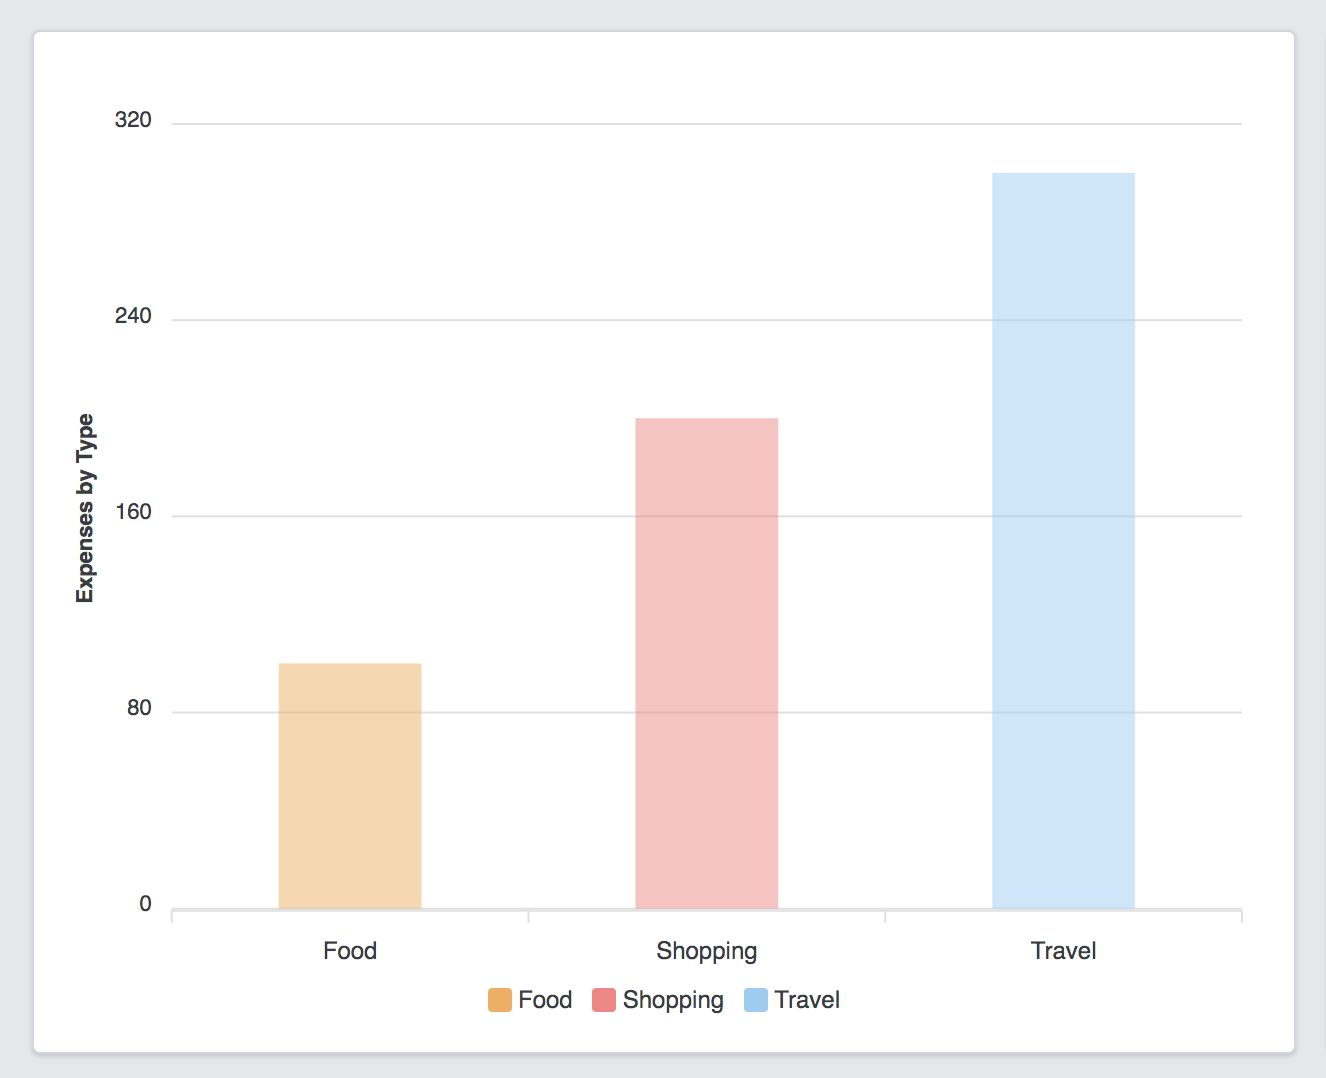
$columnChartModel = (new ColumnChartModel()) ->setTitle('Expenses by Type') ->addColumn('Food', 100, '#f6ad55') ->addColumn('Shopping', 200, '#fc8181') ->addColumn('Travel', 300, '#90cdf4');Then on the frontend, you pass the variable to blade:
<livewire:livewire-column-chart :column-chart-model="$columnChartModel"/>The code above are examples taken directly from the readme. Using the example code, you would have a chart that looks like the following:

At the time of writing, livewire-charts supports three types of charts:
- Line chart
- Column chart (as seen above)
- Pie Chart
You can also enable interactions and provide listeners that will fire in Livewire components, along with the ability to make charts reactive. Be sure to check out the livewire-charts readme for full details on usage.
Learn More
You can learn more about this package, get full installation instructions, and view the source code on GitHub at asantibanez/livewire-charts. Andrés also has a Livewire Charts demo app with examples.


