The laravel-xhprof package makes it easy to use Xhprof to profile your laravel application. This package includes profiling for your web application routes and the Artisan console.
XHProf is a function-level hierarchical profiler for PHP and has a simple HTML based navigational interface. The raw data collection component is implemented in C (as a PHP extension). The reporting/UI layer is all in PHP. It is capable of reporting function-level inclusive and exclusive wall times, memory usage, CPU times and number of calls for each function. Additionally, it supports ability to compare two runs (hierarchical DIFF reports), or aggregate results from multiple runs.
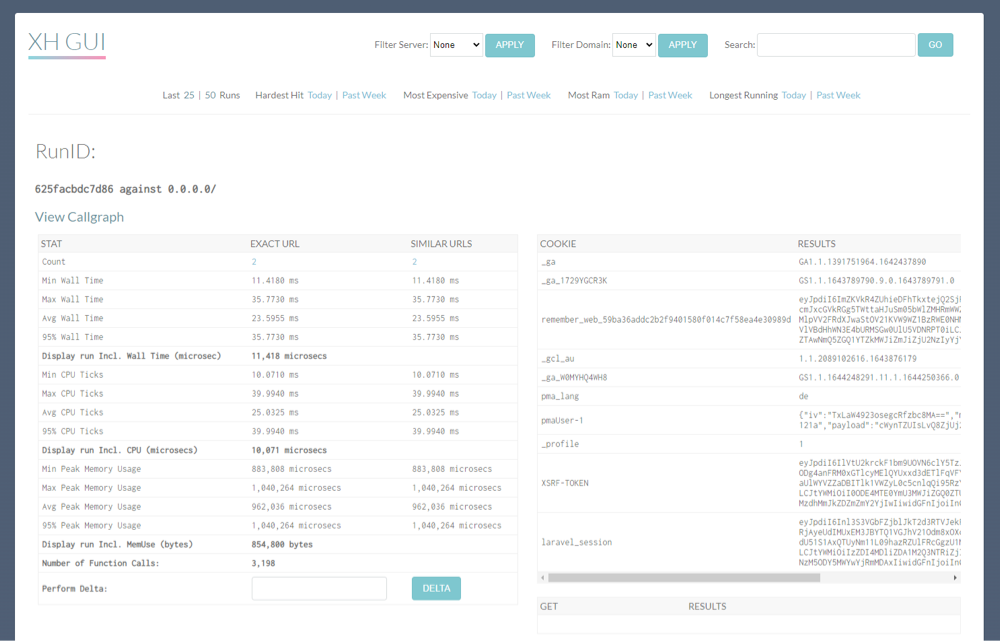
Along with the Laravel side of this package that will trace your requests when XHPROF_ENABLED=true in your .env file, you can visualize the profiling with XHGUI, which uses a database backend, and pretty graphs to make it easy to use and interpret:

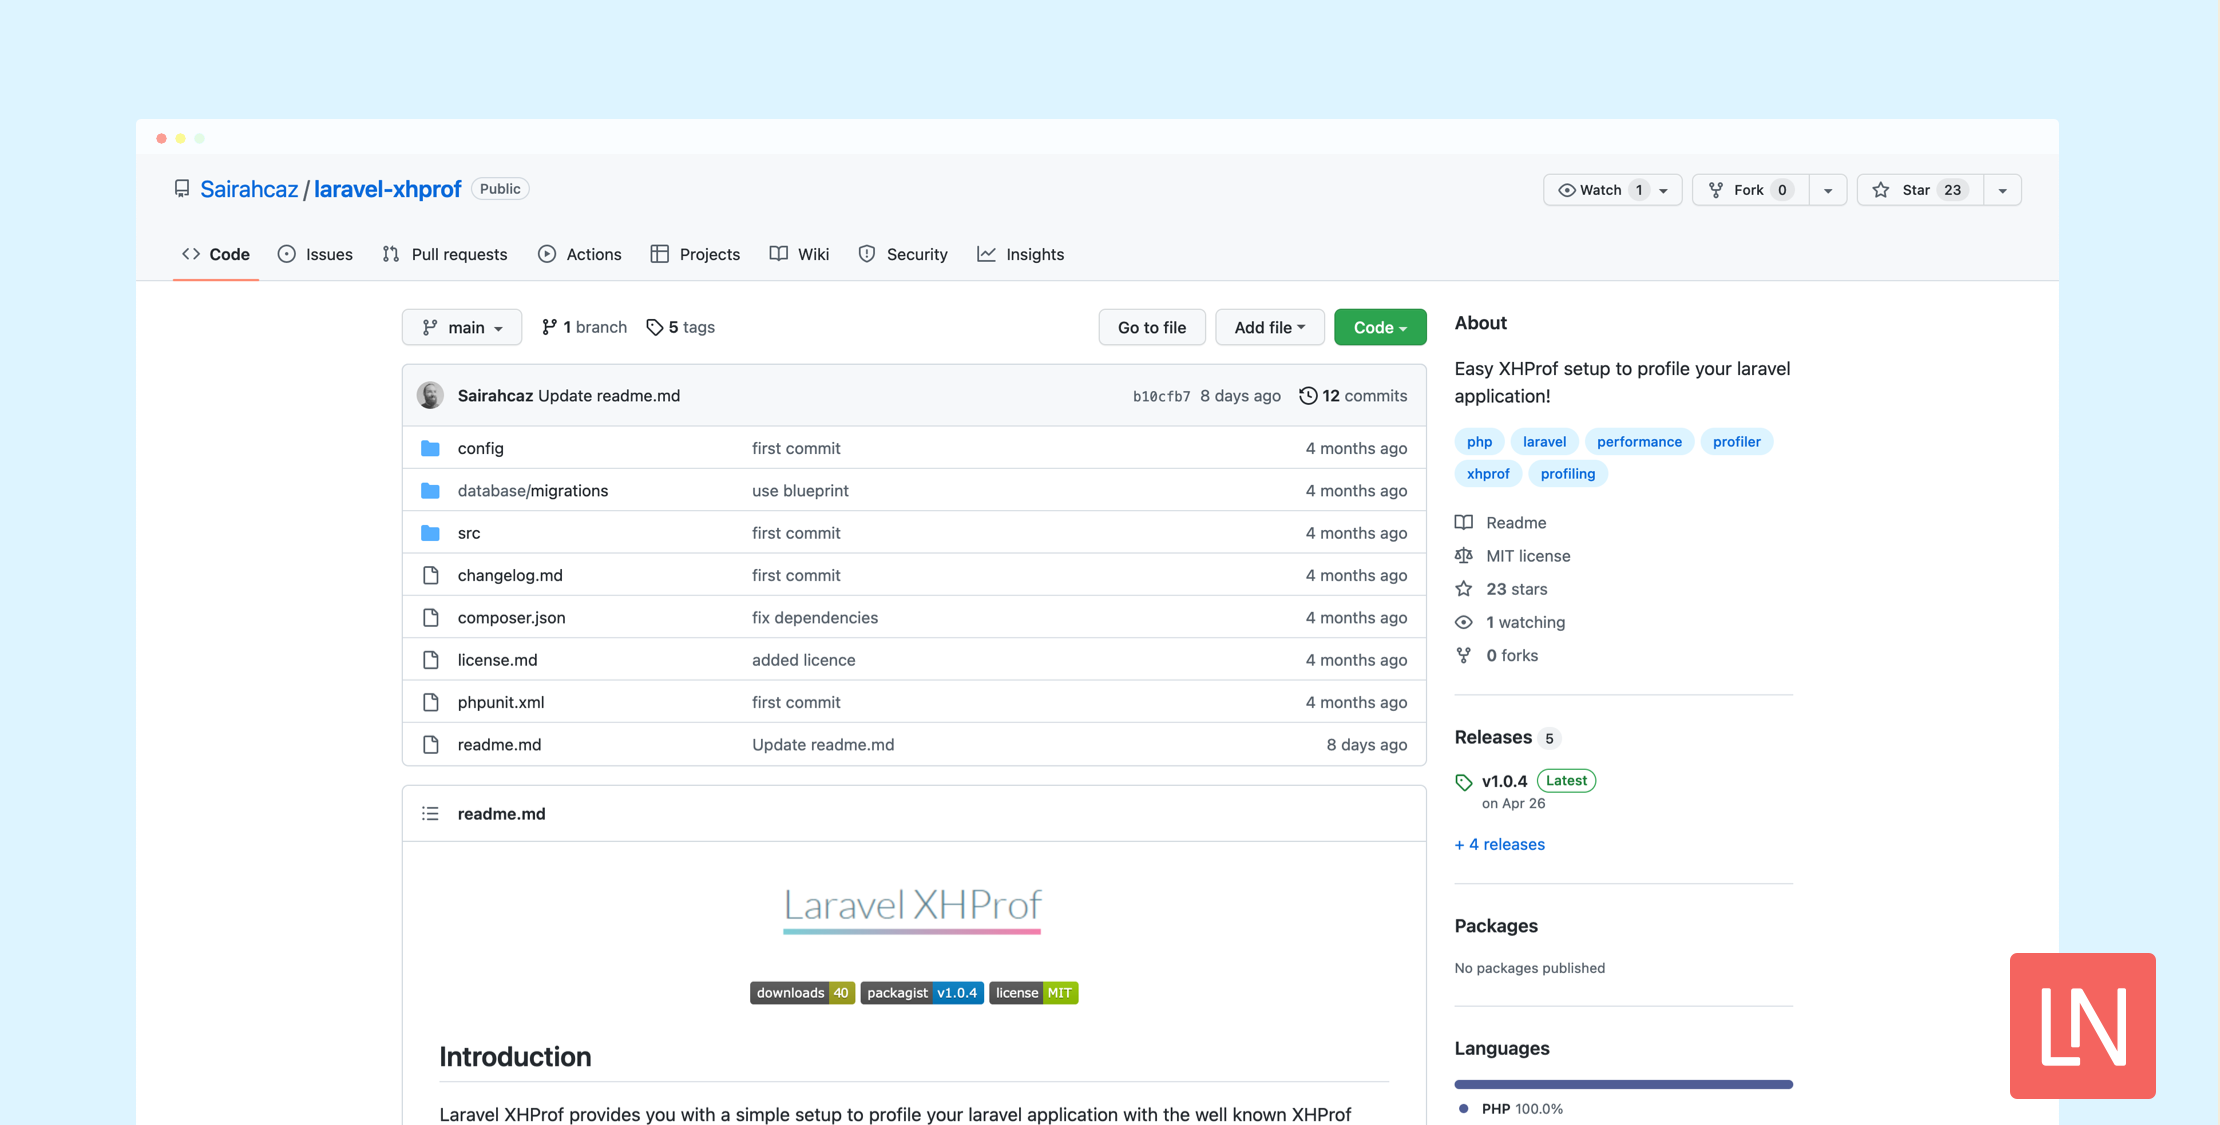
The laravel-xhprof GitHub repo has all the instructions you need to set up the XHProf PHP module, the GUI, database configuration, and more.


