If you are debugging locally and want to understand what a request did, Laravel Telescope is exactly the right tool. But Telescope is not built for production, and it was never meant to be.
In production, your tools are usually logs, an error tracker, and a general-purpose APM with a "Laravel integration" bolted on. You piece together what happened from fragments across multiple interfaces that know nothing about each other.
That is the gap a Laravel-native tool can actually close.
Laritor is a production observability tool built specifically around how Laravel applications are structured. Not adapted. Built.
Where request performance issues actually come from
A request to /checkout feels slow. You open your logs, filter by timestamp, and start guessing. Is it the Stripe API call? An unindexed query? A new feature you shipped behind a flag last week that turned out to be heavier than expected? The logs confirm something was slow but not which part or why.
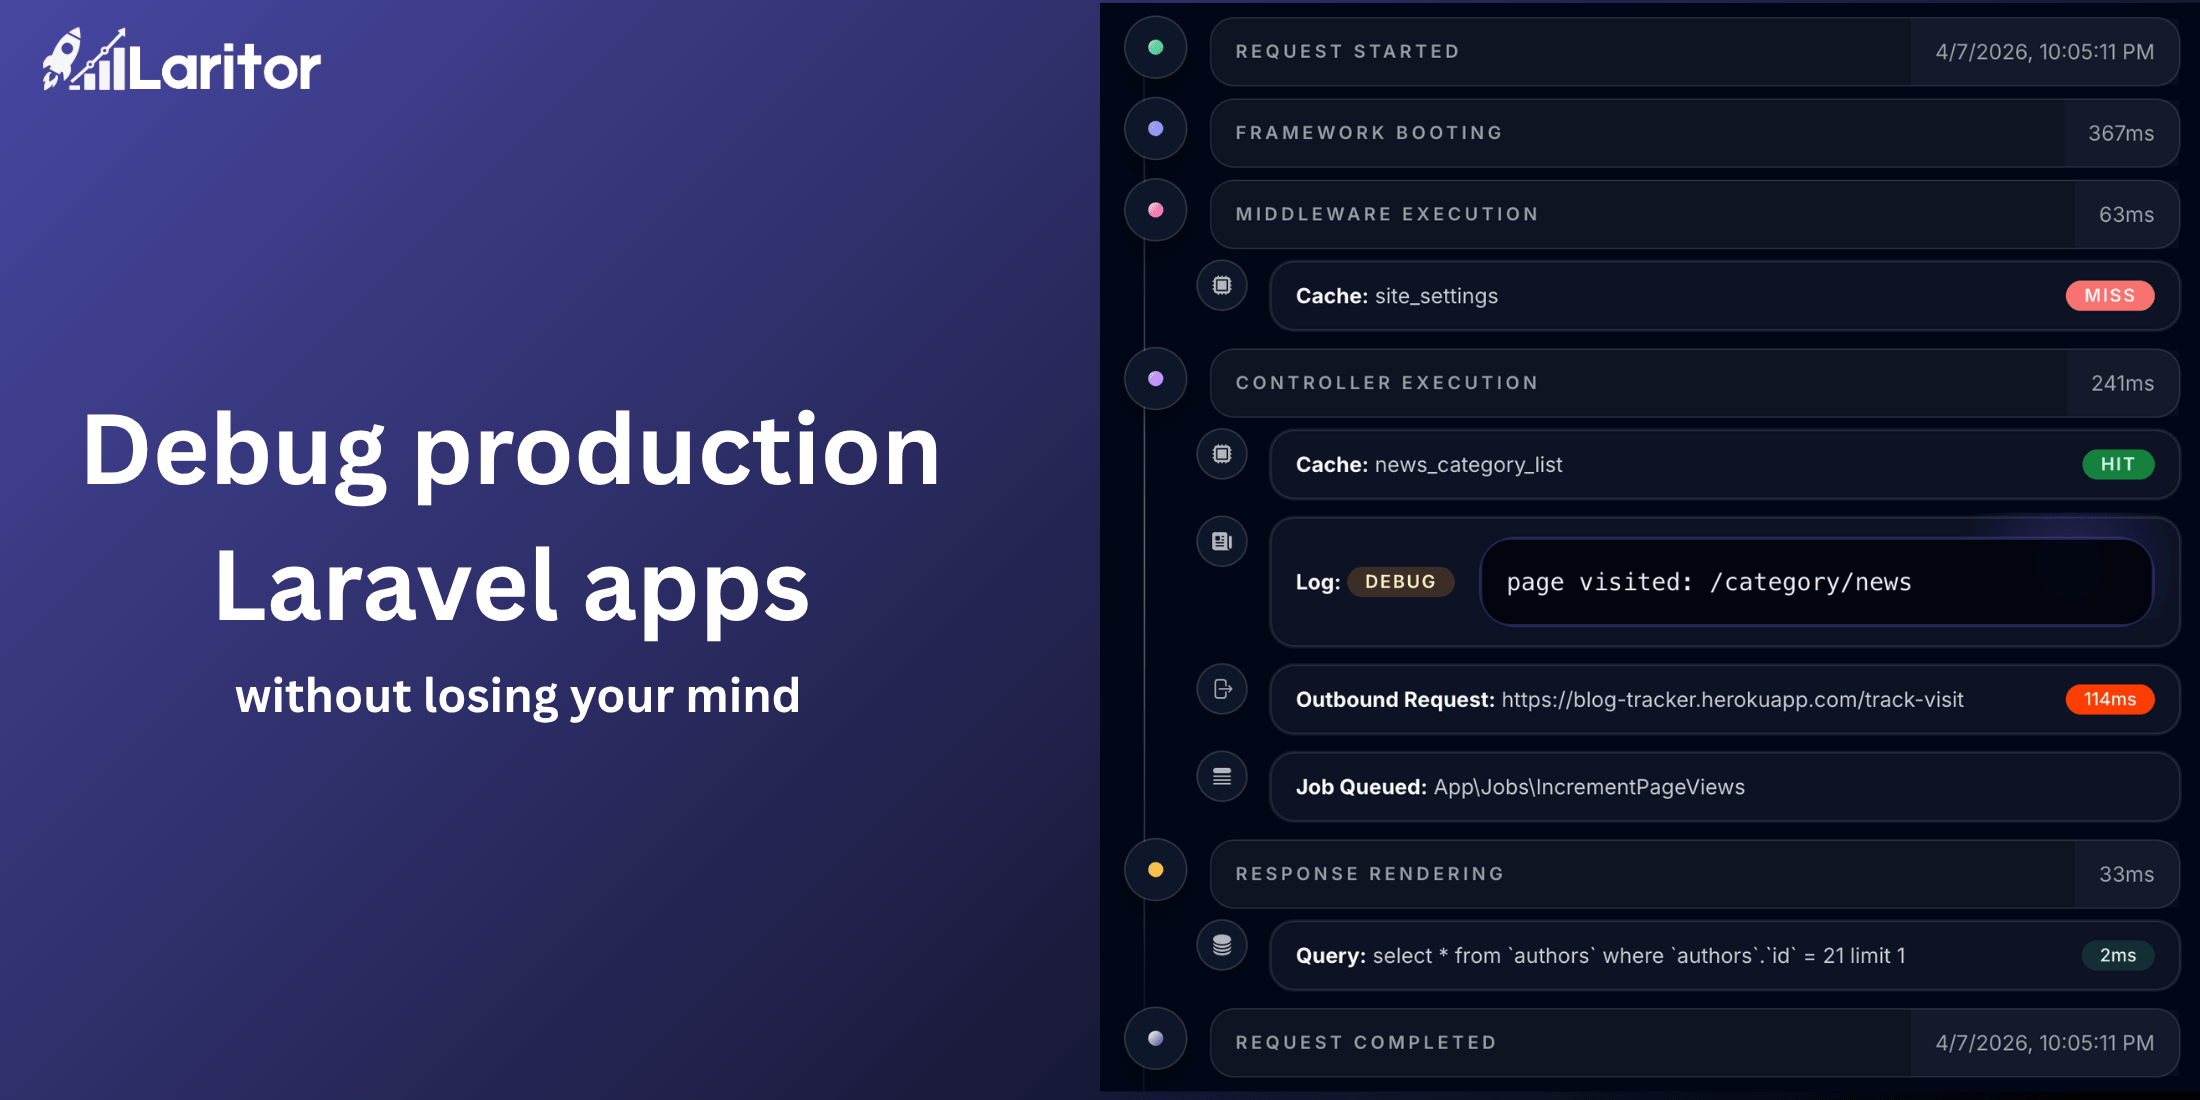
Laritor captures everything in a single timeline per request: every query with its execution time, every outbound HTTP call, every feature flag evaluation, every cache hit and miss. The bottleneck is usually obvious within 30 seconds.
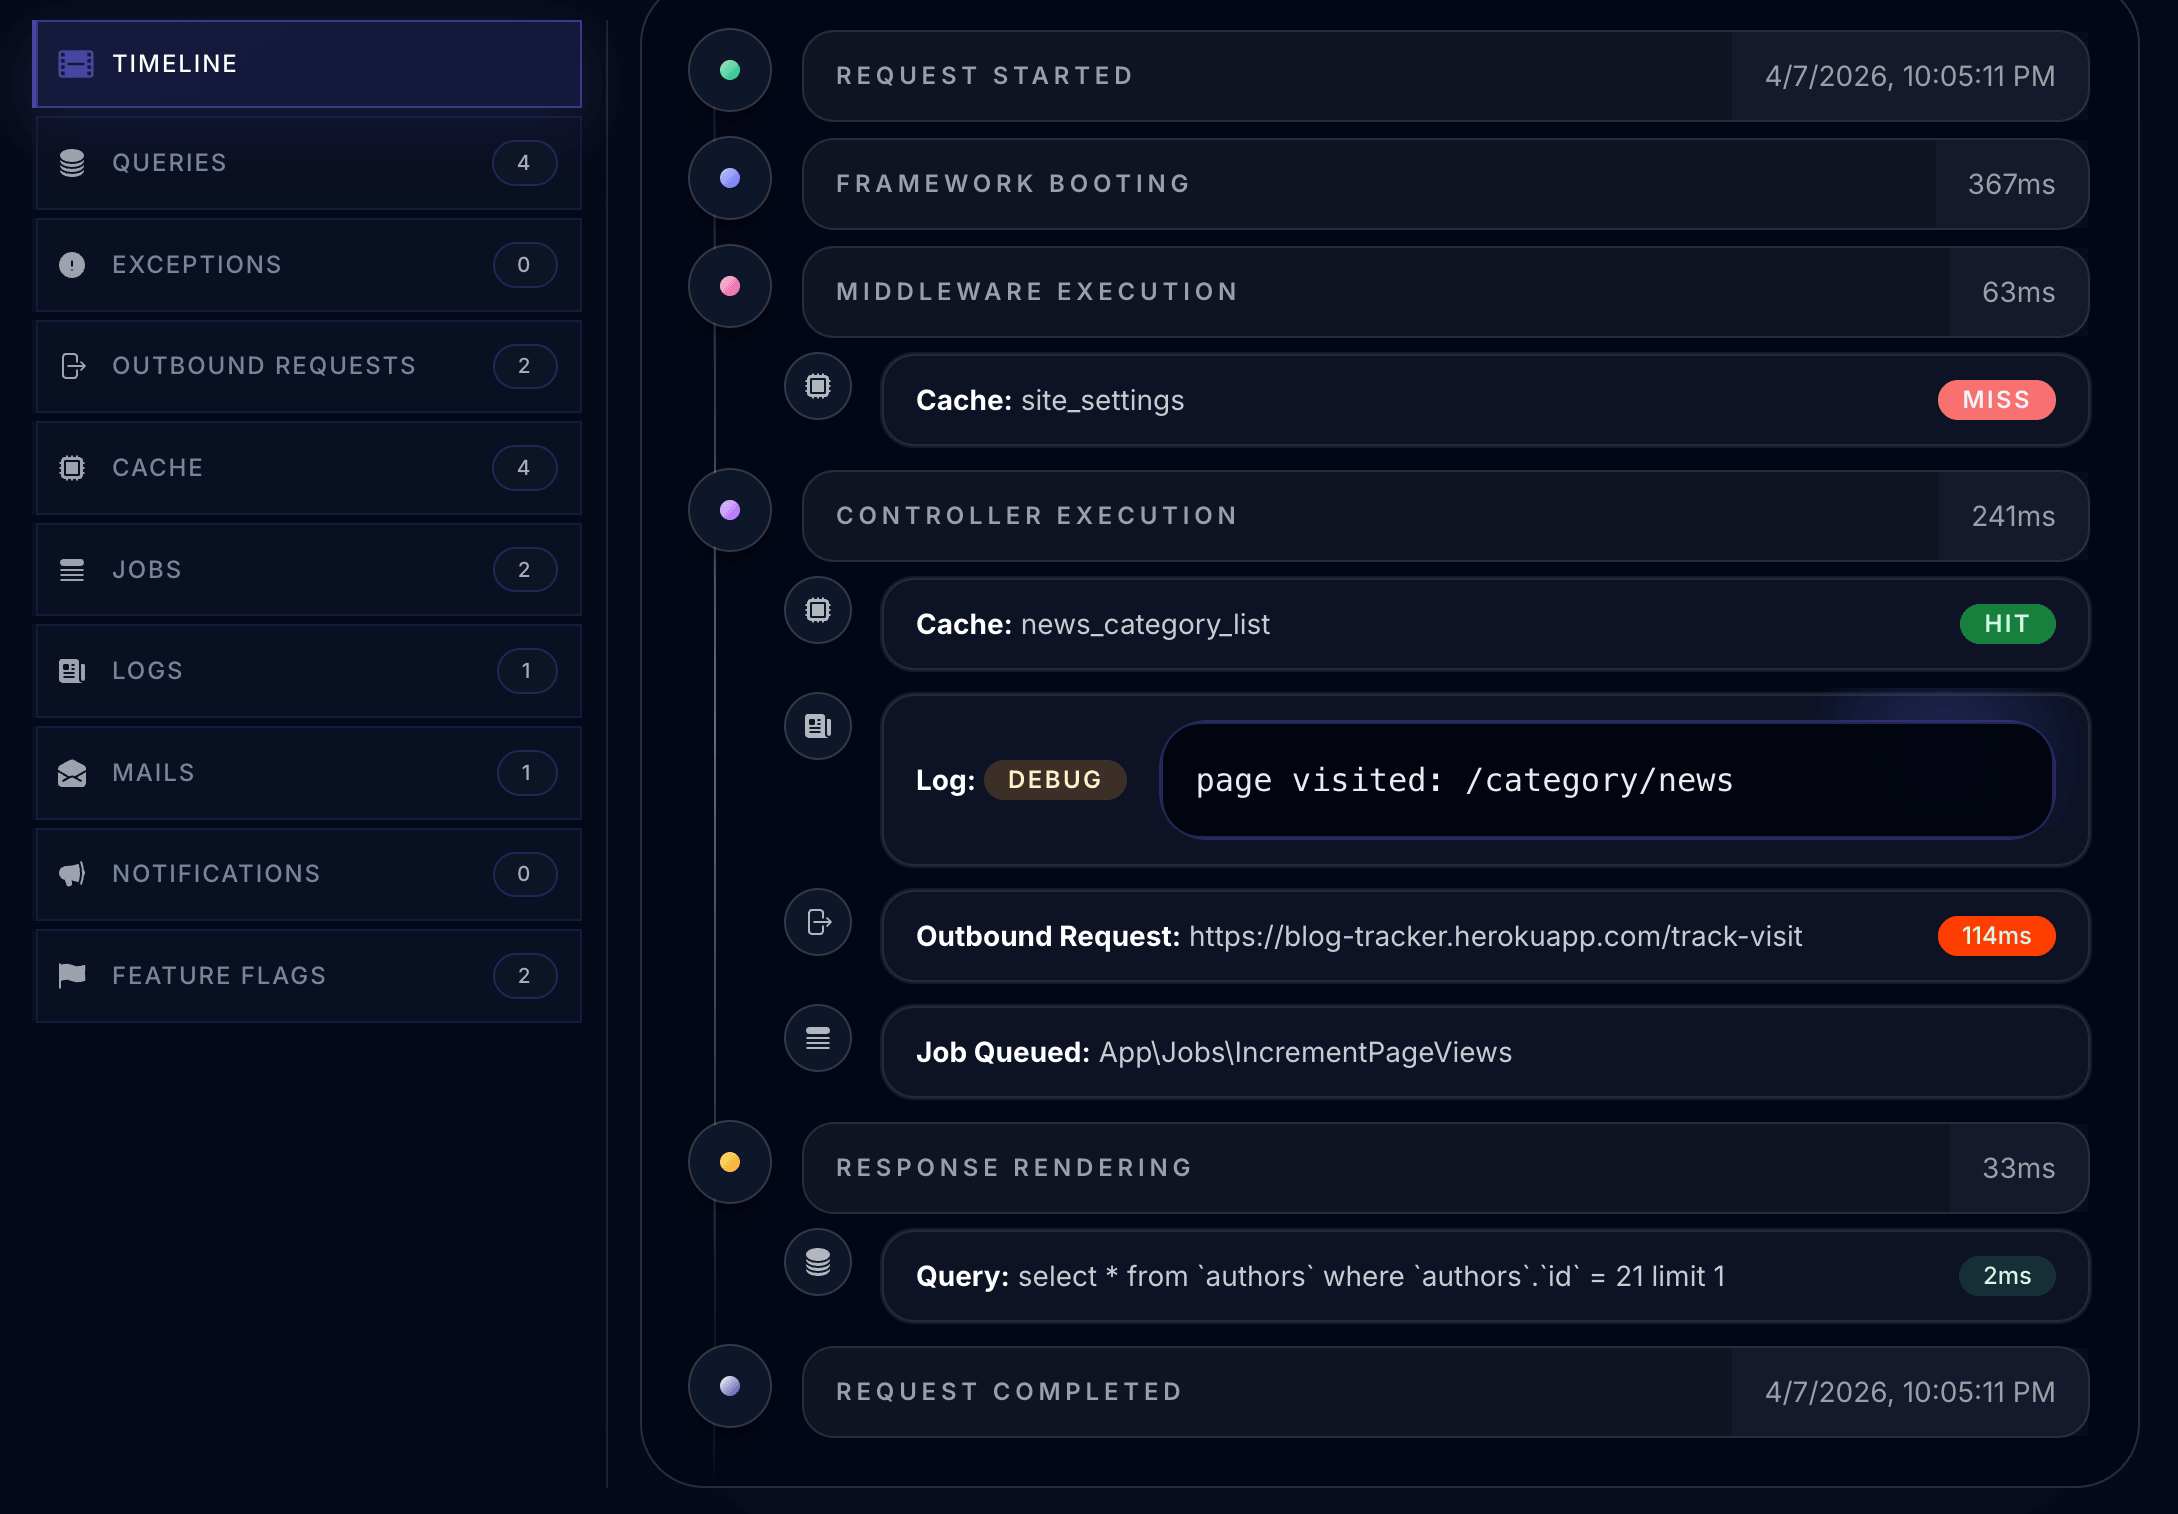
The point is not just that everything is visible. It is that the relationships between things are visible.
Queue visibility that goes beyond process or fail
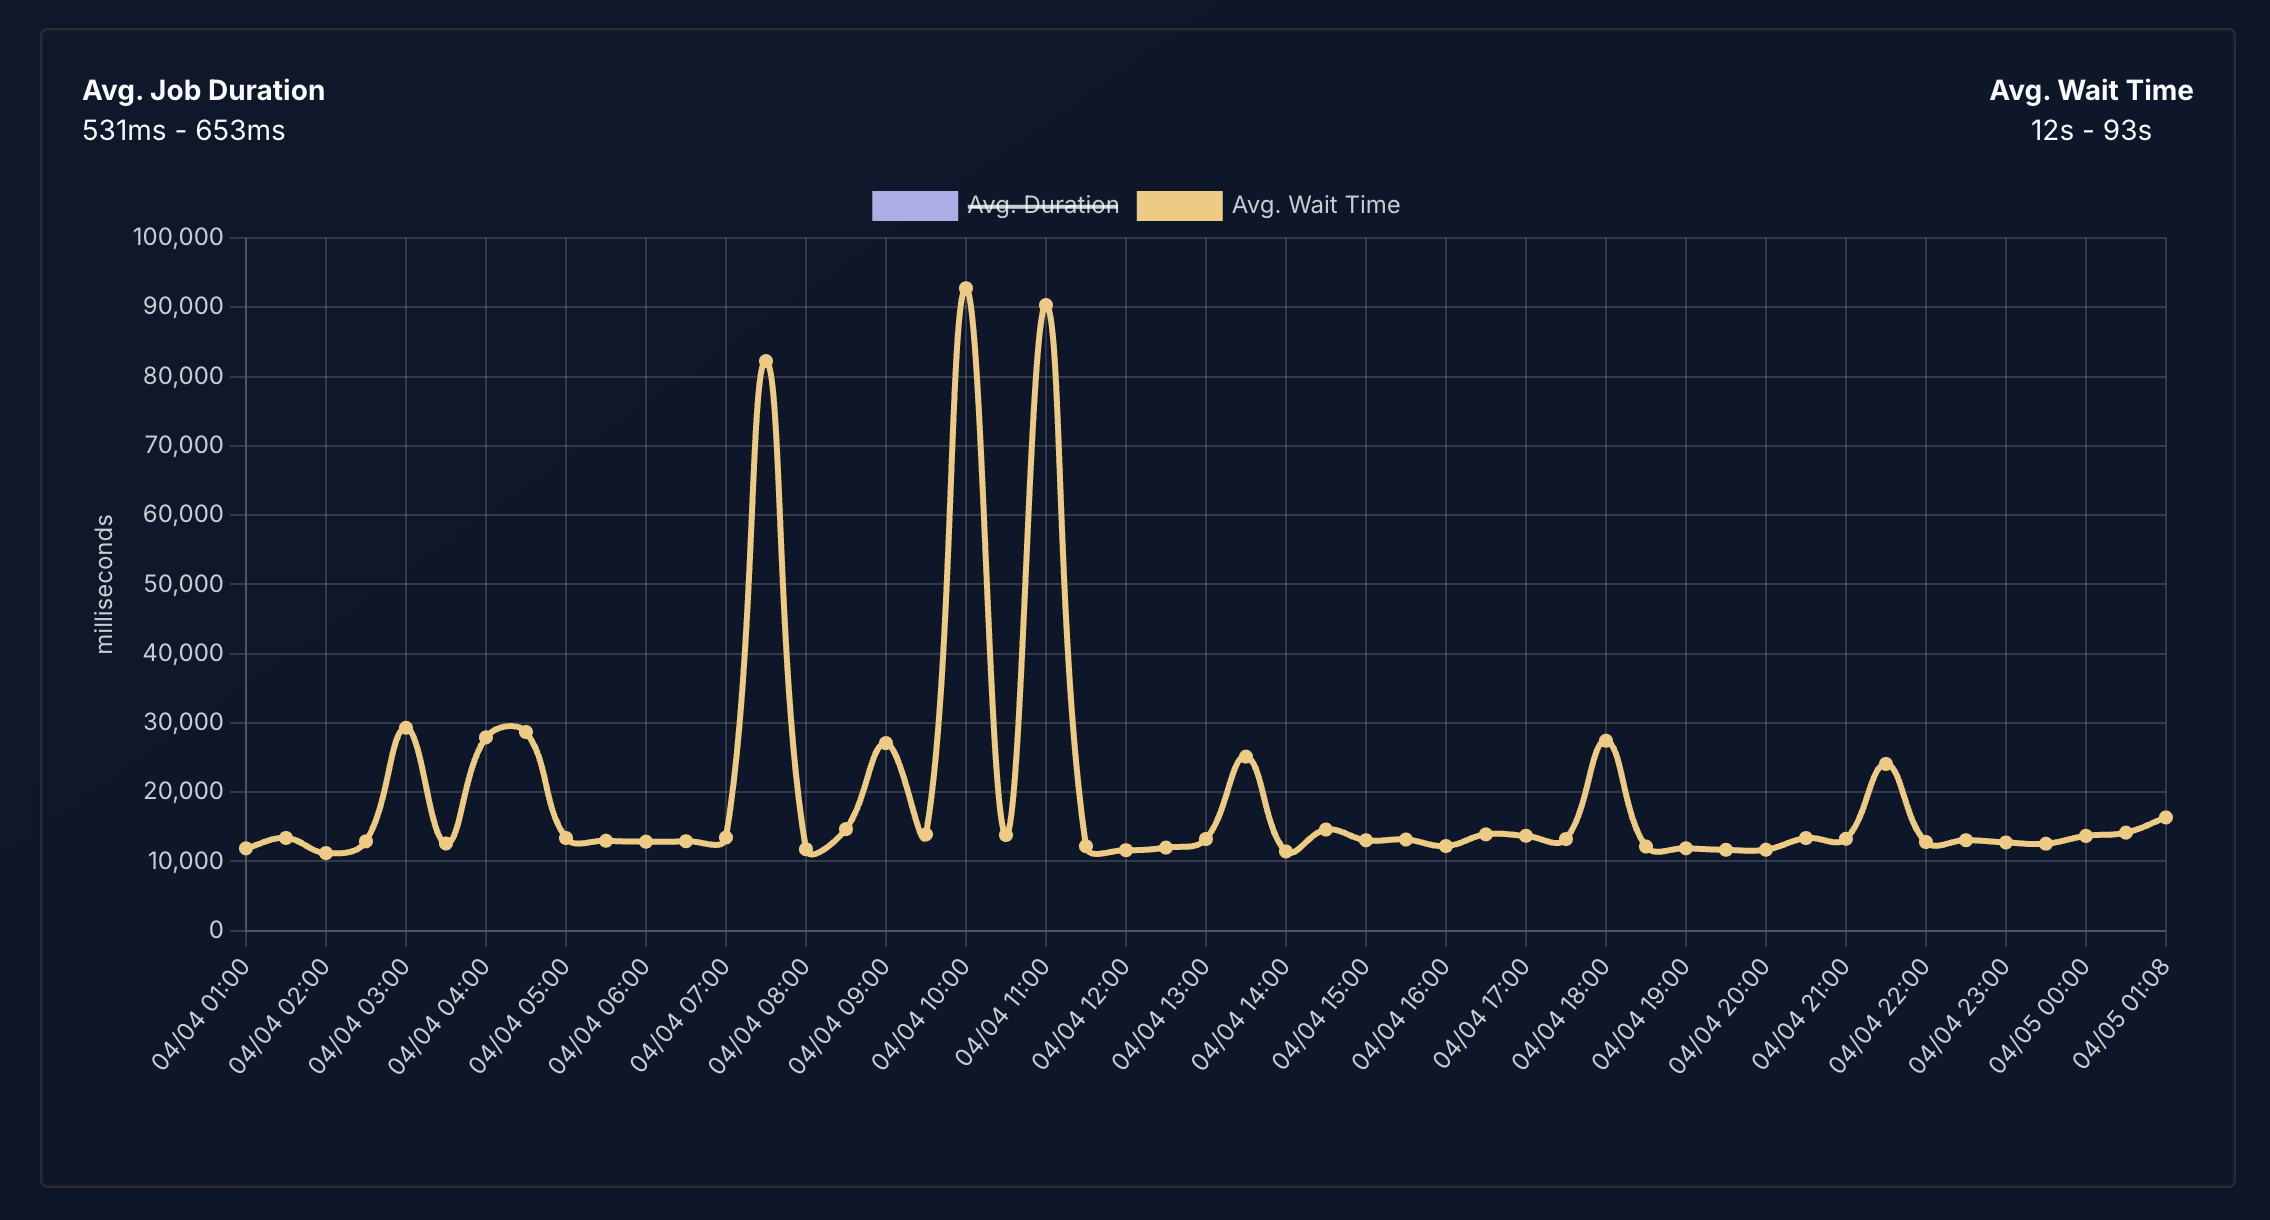
Most tools tell you when a job failed. Laritor shows you what your queue system is doing over time: jobs processed, failed, and pending, average wait time, and a line graph of dispatched volume so you can see exactly when a spike started and how long jobs are sitting before pickup. The kind of detail that answers "why were notifications delayed at 3pm on Tuesday" without guessing.
The actual setup
Getting started takes less than 30 seconds.
Install the Composer package:
composer require binarybuilds/laritor-clientAdd three variables to your .env:
LARITOR_ENABLED=trueLARITOR_INGEST_ENDPOINT=your-endpointLARITOR_BACKEND_KEY=your-keyThat is the entire setup. No agents, no sidecar processes, no changes to your infrastructure. It works on Vapor, Forge, Cloud, Docker or custom VPS right out of the box.
Dashboards and alerts
Once data is flowing, you get a default performance overview plus a library of 90+ widgets to build dashboards around the parts of your app that actually matter. Set up alerts for any performance threshold and have them delivered to Slack, Discord, Teams, email, or any webhook. Laritor can also open issues automatically in GitHub or Linear so regressions land in your backlog without anyone having to notice them first.
The AI layer, honestly
There is an AI analysis feature worth mentioning for one specific reason: it is schema-aware. It analyzes your queries against your actual database structure, so indexing suggestions are specific to your tables rather than generic advice. It can trace a slow request back through the full execution path and identify which external call, query pattern, or feature evaluation is responsible.
It is a useful layer. It is not magic.
If you are running Laravel in production and want to see what is actually slowing your app down, Laritor is worth trying. The free tier includes 300K events per month, unlimited apps, and unlimited seats.