I want to show you some tools and techniques you can use to measure anything and everything that you want in your Laravel applications with StatsD. These ideas are simple and not new; yet, I believe that the simplicity and power are what makes StatsD great.
You can also take the ideas in this article and apply them to any programming language or stack. Instrumenting your code can have a huge payoff as your application scales and can help you gain deep insights.
Most importantly, adding new instrumentation to your application should be as painless as possible for developers. Any friction in the collecting and reporting of new insights means developers won’t use it. I think a good measurement of “frictionless” is for a developer to start collecting on any metric in production in thirty minutes or less.
Enter StatsD:
A network daemon that runs on the Node.js platform and listens for statistics, like counters and timers, sent over UDP or TCP and sends aggregates to one or more pluggable backend services (e.g., Graphite).
StatsD is a simple, easy way to start collecting metrics quickly and displaying them in a graphing program. The great thing about StatsD is that the calls happen over UDP, which is fast, and a “fire-and-forget” transaction. Also, the code in development won’t be affected if you’re not running StatsD.
Why You Should Instrument Your Code
In the context of web applications and services, instrumentation can be grouped into three critical areas: network, server, and application. We will be focused on application instrumentation, or to put it another way, measuring metrics in your code, such as timing, gauges, and increments.
You can measure everything from how many logins you’re application has seen in the last hour, to how quickly a model method runs a database query on average. Another example might be measuring the average time a controller method takes to run. The possibilities are endless!
Instrumentation is an addicting habit you can use to build intelligence which can help you make decisions and respond to issues backed by data. Measuring performance can prove or debunk theories you have about your code using insights that only production can provide.
I believe that application-level instrumentation is probably the most complicated tier, but the payoff can be huge to the health and growth of your applications. If you’re not using instrumentation in your code yet, you probably don’t have a good idea of how your application performs at scale.
Let’s change that and see how quickly you can start incorporating StatsD into your application stack. I am not going to minimize the fact that you’ll need some support in running and maintaining StatsD and Graphite in production, but setting it up on Digital Ocean isn’t too hard. We will just use a local Docker container to make things easy for you so you can focus on experimenting.
Getting Started
The beautiful thing about the Graphite Docker container is that Graphite and StatsD are self-contained and you can get them running in one command.
From the Graphite Installation Guide you can run the following Docker command (I’ve modified the port to 8100 since port 80 is in use on my machine):
docker run -d\ --name graphite\ -p 8100:80\ -p 2003-2004:2003-2004\ -p 2023-2024:2023-2024\ -p 8125:8125/udp\ -p 8126:8126\ graphiteapp/graphite-statsd37f5884a063f2e3df1e13377e7221e0aff7f5f7079b16b38ff764f3490c95d57If you go to http://localhost:8100, you should see the Graphite interface! We are ready to send calls to StatsD through a laravel app and start visualizing metrics with Graphite.
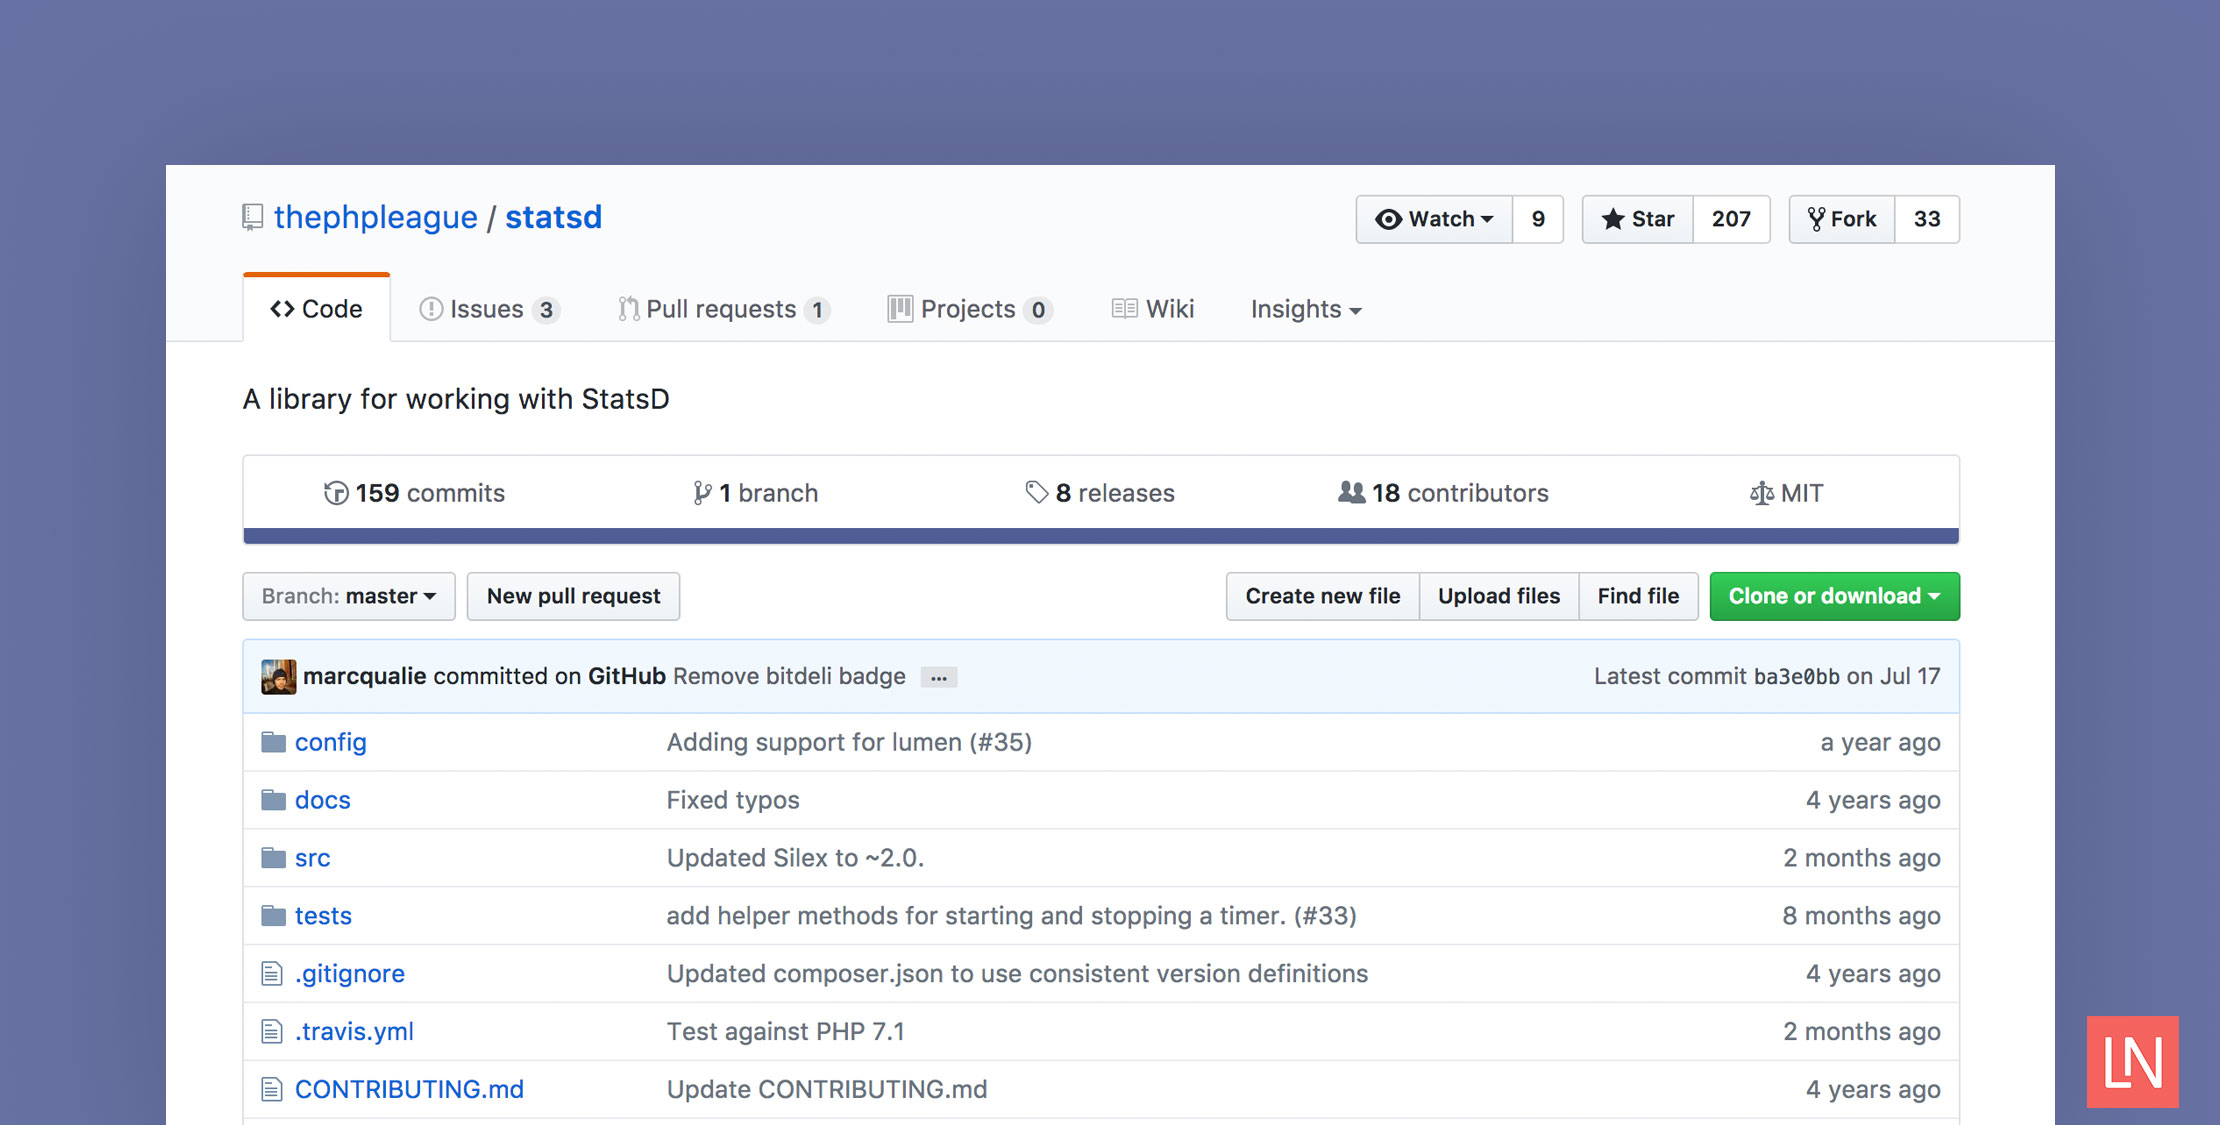
Next, we need to install Laravel 5.5, and we are going to use the league/statsd package to send metrics to StatsD over UDP:
$ laravel new laravel-statsd$ cd laravel-statsd $ composer require league/statsdAt the time of this writing, the League StatsD package doesn’t configure package auto-discovery (I have submitted a PR for it ;), so you need to manually set the service provider and facade:
// Provider'providers' => [ // ... League\StatsD\Laravel5\Provider\StatsdServiceProvider::class,], // Facade'aliases' => [ // ... 'Statsd' => League\StatsD\Laravel5\Facade\StatsdFacade::class,]Next, publish the configuration for the StatsdServiceProvider:
php artisan vendor:publish --provider="League\StatsD\Laravel5\Provider\StatsdServiceProvider"You will not need to update the config/statsd.php file with the Docker container we are running, but having this configuration on hand will be useful when you run StatsD in production.
To verify the installation is working, make sure you can resolve the StatsD client via Laravel’s service container:
$ php artisan tinker>>> app('League\StatsD\Client');=> League\StatsD\Client {#713}>>> app('statsd');=> League\StatsD\Client {#719}A Simple API Counter
The simplest thing you can track with StatsD is probably a counter. You can call both increment and decrement:
# Using the FacadeStatsd::increment('pageviews');Statsd::decrement('some.metric'); # Custom delta and sample rate of 10%Statsd::increment('my.sample', 5, 0.1);The first example will increment the “pageviews” counter by one. The Statsd::decrement() method works the same way, but decrements the count.
Although you would typically track page views in your application with Google Analytics, let’s say that you wanted to monitor how many requests your API routes receive. Monitoring your API requests/second could be super valuable, a good indicator of the health of your application, and you would start to see some trends.
In the simplest form, we could build a middleware for this purpose. Let’s try it out!
First, create the middleware:
$ php artisan make:middleware RequestCounterNext, let’s define the middleware with a parameter defining what type of request is being counted:
<?php namespace App\Http\Middleware; use Closure; class RequestCounter{ /** * Handle an incoming request. * * @param \Illuminate\Http\Request $request * @param \Closure $next * @return mixed */ public function handle($request, Closure $next, $type) { \Statsd::increment("requests.{$type}"); return $next($request); }}We use the Statsd facade to increment the requests.$type counter. Using dots (.) separates the value into folders in the Graphite interface. For example, requests.api would make a folder requests/api/ as you will see in a moment.
Next, let’s add this middleware to the App\Http\Kernel.php file in both the web and API groups:
protected $middlewareGroups = [ 'web' => [ 'counter:web', // ... ], 'api' => [ 'counter:api', 'throttle:60,1', 'bindings', ],]; protected $routeMiddleware = [ // ... 'counter' => \App\Http\Middleware\RequestCounter::class,];Now our routes will get counted with every request! We are ready to start working with Graphite and visualizing our metrics being tracked through this middleware.
The first thing we are going to use in Graphite is the dashboard. Visit http://localhost:8100/dashboard. Click “Relative Time Range” and pick “Show the past 1 minutes” and click “OK.” Enable Auto-Refresh and make it refresh every 5 seconds. It should look something like the following:
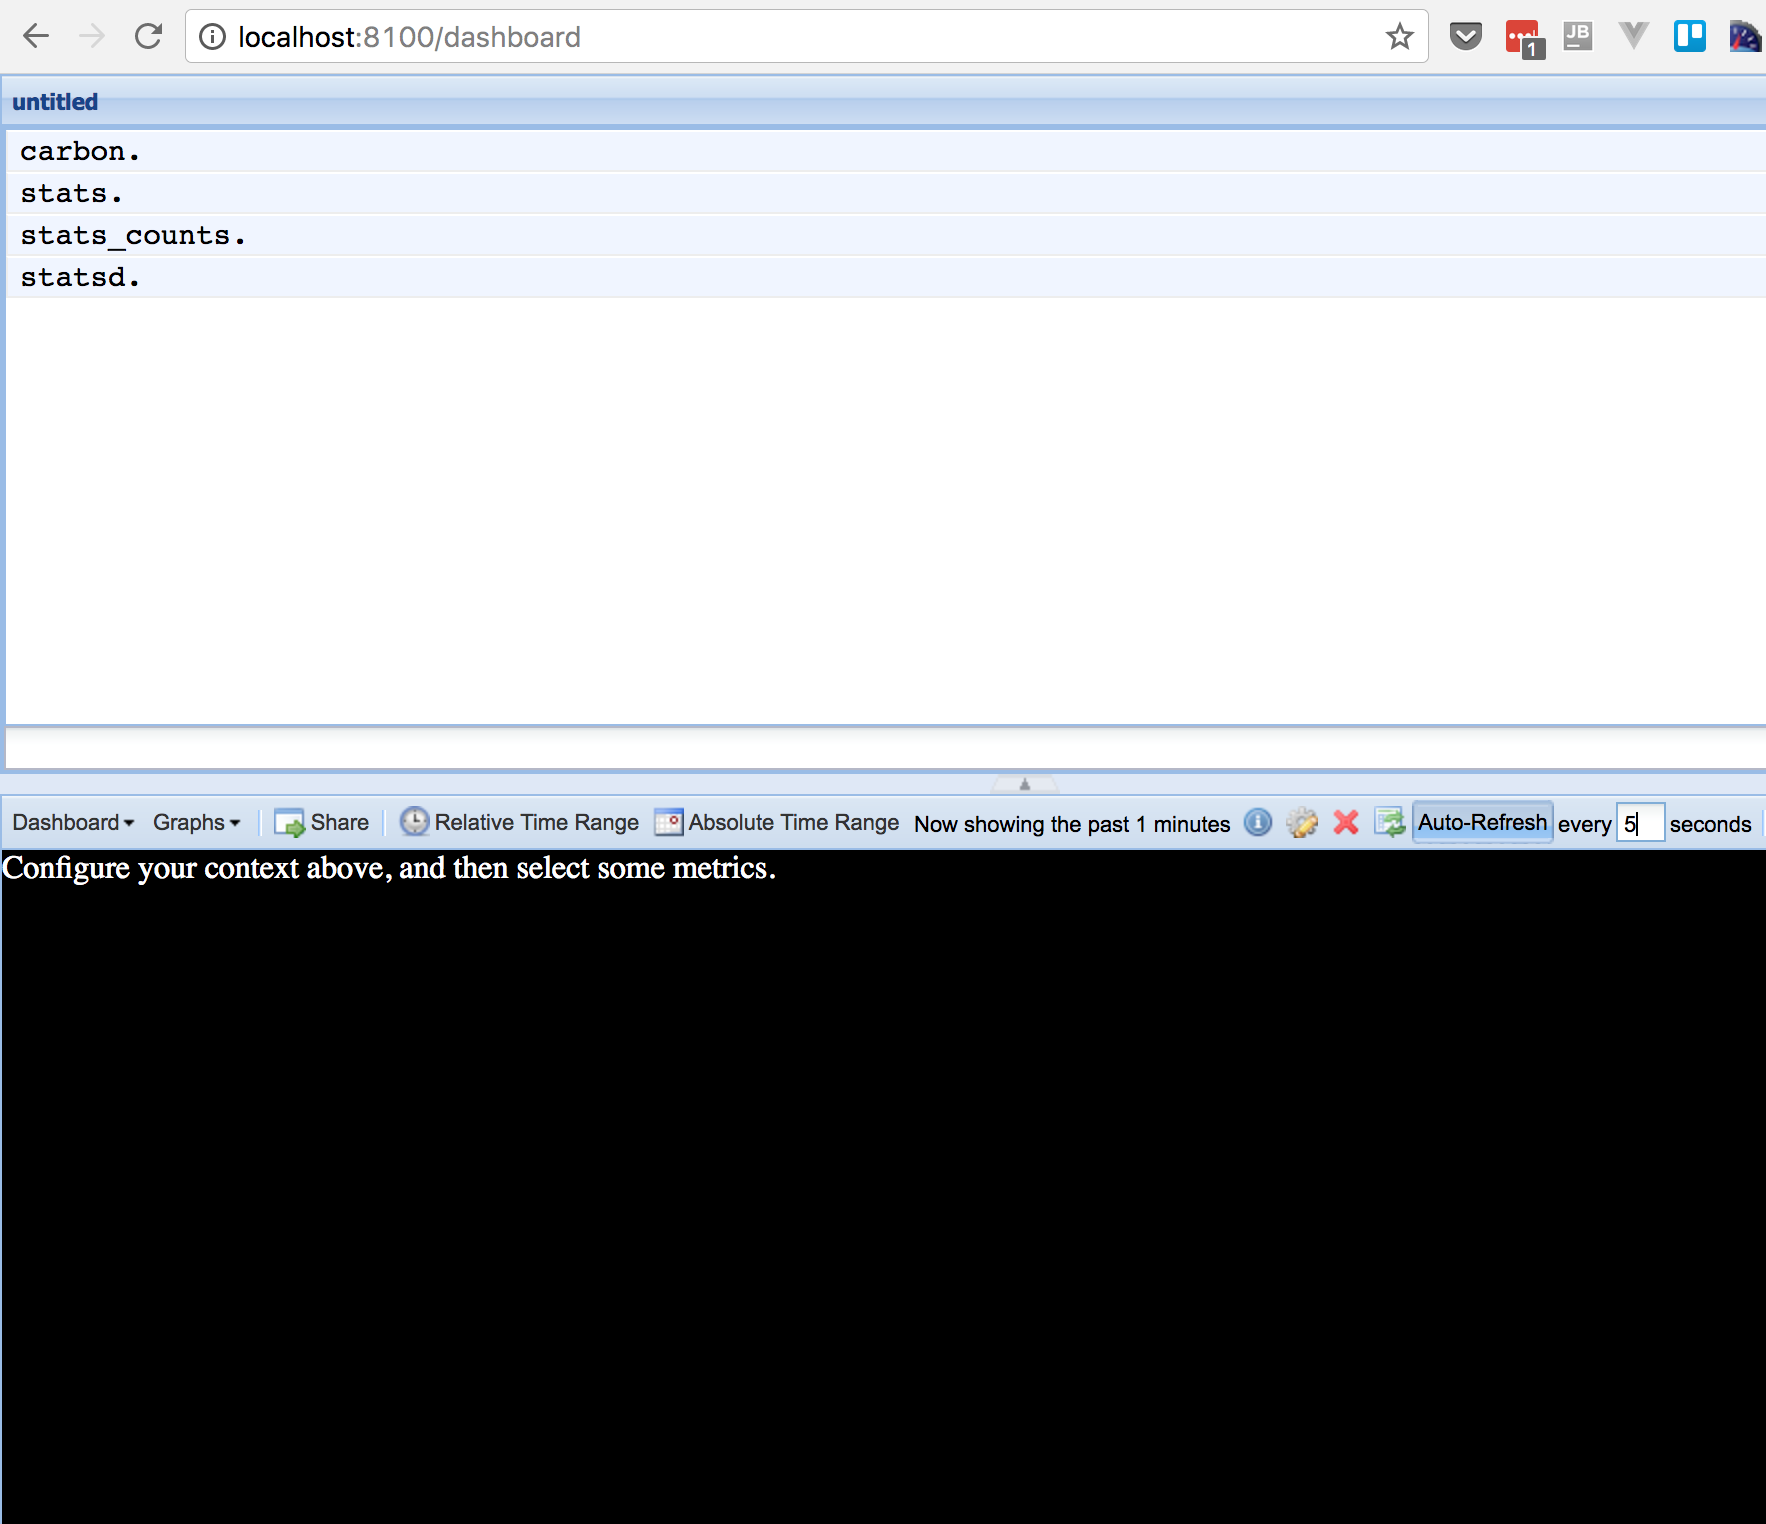
The dashboard UI allows you to filter by metric and build out dashboards that auto-update that you can use to monitor things in real-time.
We haven’t collected any data yet, so we need to define a route and run some HTTP requests to trigger our middleware.
Let’s set a test web route in routes/web.php:
// routes/web.php Route::get('test', function () { return 'OK'; });To simulate traffic, use seige or Apache Benchmark. Siege is show, but ab would be similar:
$ brew install siege $ siege -t 60s -c 20 http://laravel-statsd.app/testWe run Siege for 60 seconds with 20 concurrent users. While Siege is running, jump back over to the graphite UI and enter (or pick at the top) “stats.requests.”. It should start looking like this:
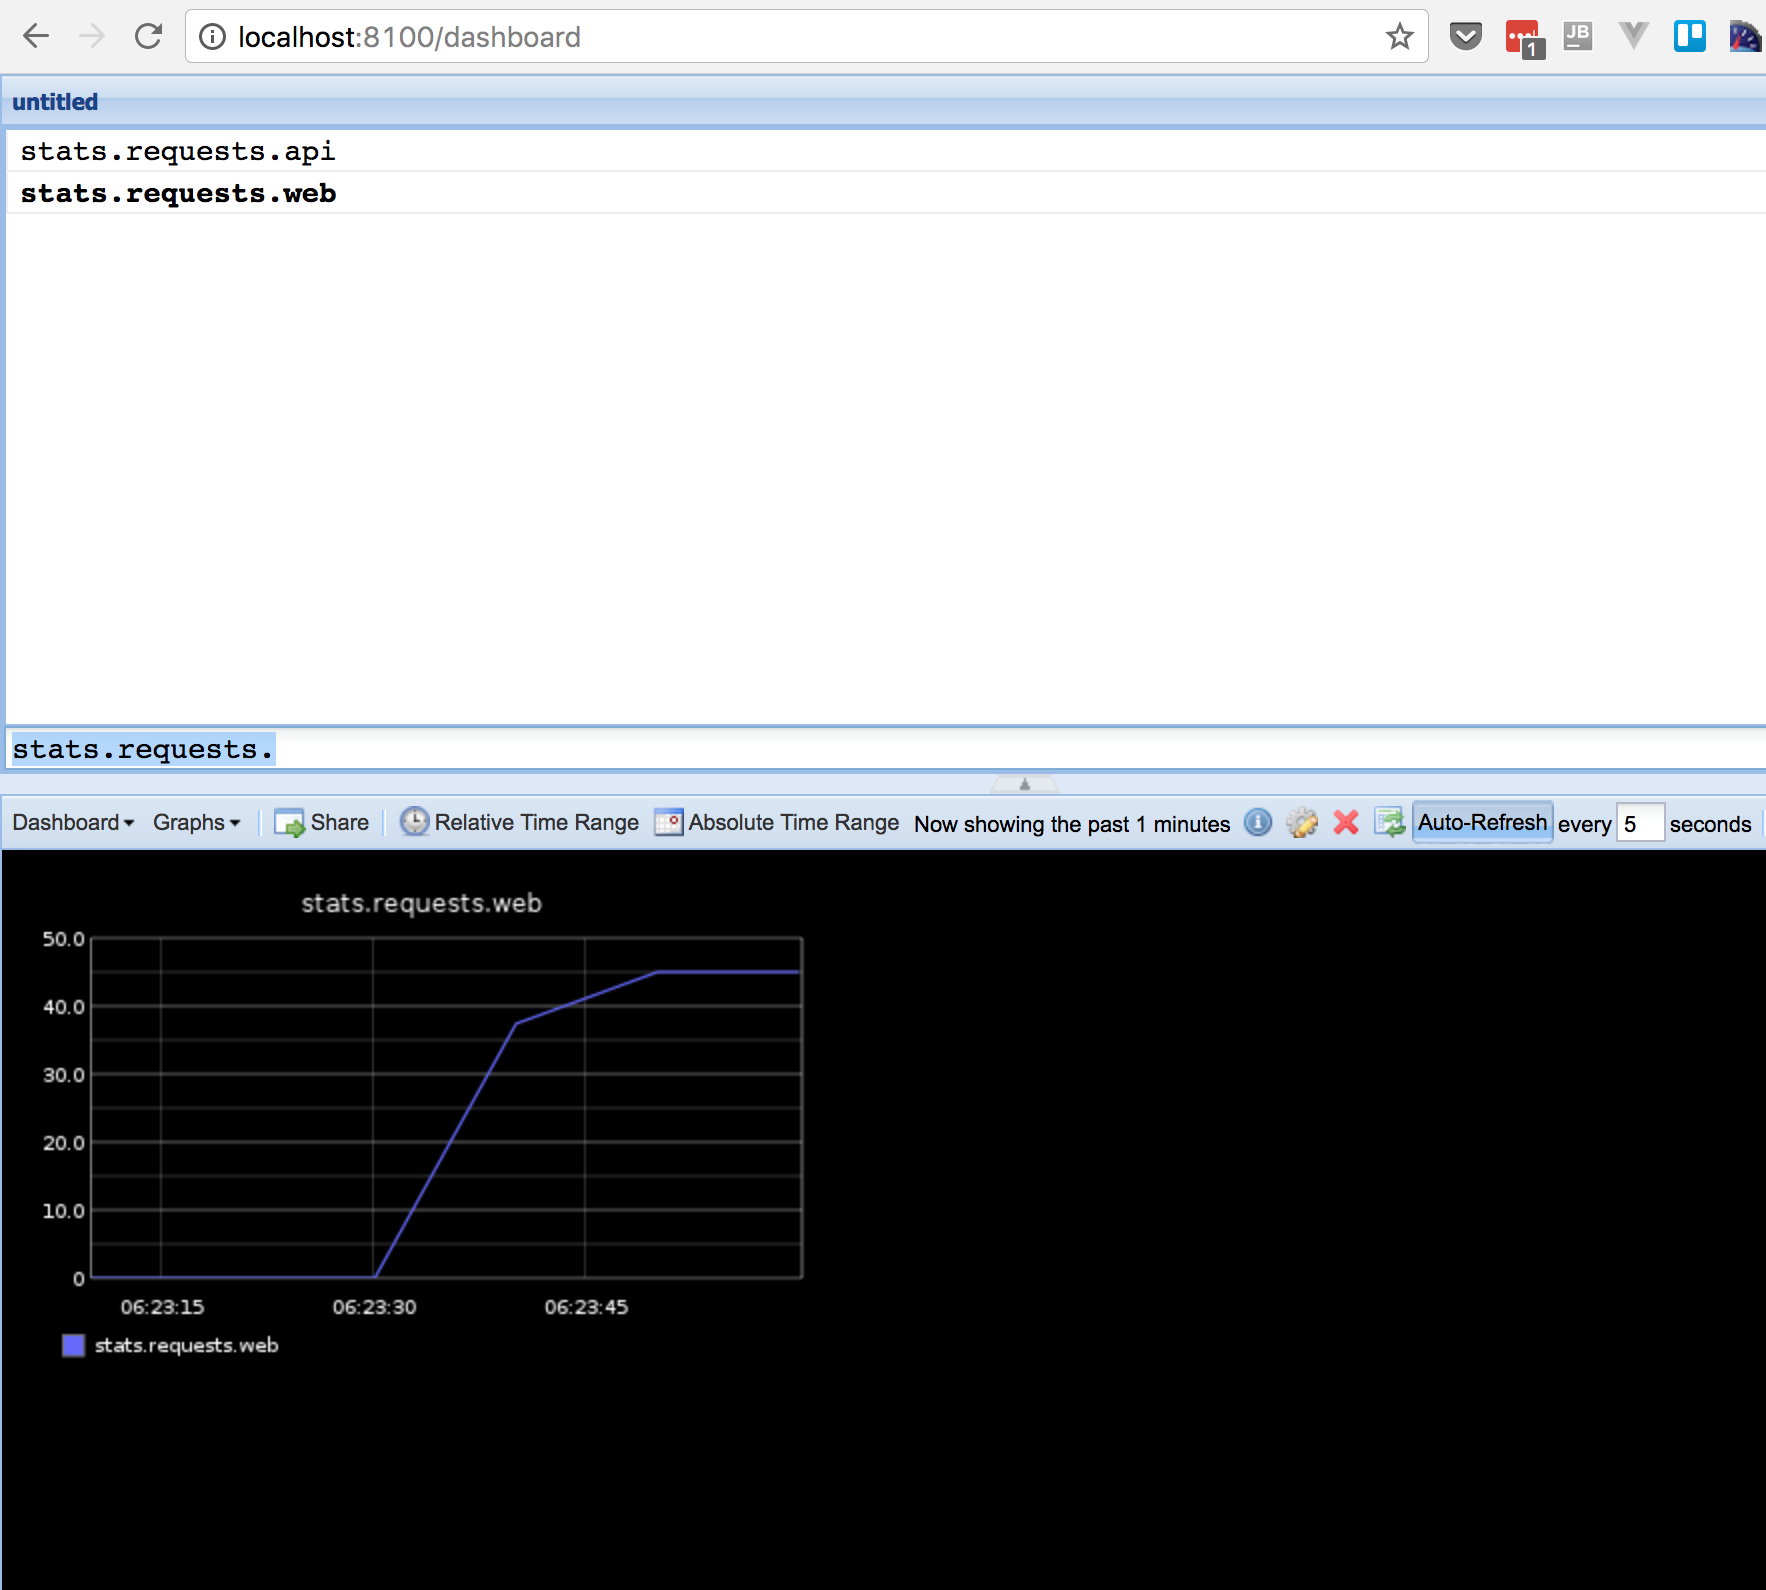
And you’ve just written your first custom StatsD counter! Are you hooked yet?
Monitoring Controllers
Let’s say that you want to track how long it takes for a controller action to run. If you overload the Illuminate\Routing\Controller::callAction() method, you can track the rough time it takes to call a controller action. We could use an after middleware, but the callAction technique means we aren’t timing any middleware, just the controller action.
Open up the App\Http\Controllers\Controller class and add the following method:
/** * @inheritdoc */public function callAction($method, $parameters){ // Remove App\Http\Controller // Split remaining namespace into folders $className = str_replace('\\', '.', get_class($this)); $timerName = sprintf('controller.%s.%s', $className, $method); $timer = \Statsd::startTiming($timerName); $response = parent::callAction($method, $parameters); $timer->endTiming($timerName); return $response;}This method is getting the controller class name and replacing the backslash characters with dots. After starting the timer with our metric name, we call the parent and then end the timer, giving us the time the controller action took in milliseconds.
The dots will create separate folders for each part of the namespace, so your controller metrics for each action will be organized cleanly in Graphite. You can also combine them in interesting ways.
To try out our controller timer, the next thing we need to do is create a controller and define a route:
$ php artisan make:controller TestControllerEffectively, the timer stats would be located at “stats.timers.controller.App.Http.Controllers.TestController.Index” given our controller namespace.
Here’s the @index method, which is arbitrary:
<?php namespace App\Http\Controllers; class TestController extends Controller{ public function index() { return 'OK'; }}Next, replace (or comment out the other route) with the following in the routes/web.php:
Route::get('test', 'TestController@index');Make siege on your application again, and you should start getting timer stats on the TestController:
siege -t 60s -c 20 http://laravel-statsd.app/testWhile running siege you can watch the real-time stats piling up by updating your dashboard filter. The dashboard UI allows you to add multiple graphs and save them for later use (or to display on a flatscreen TV to look legit).
Here’s what the folder structure ends up looking like in Graphite:
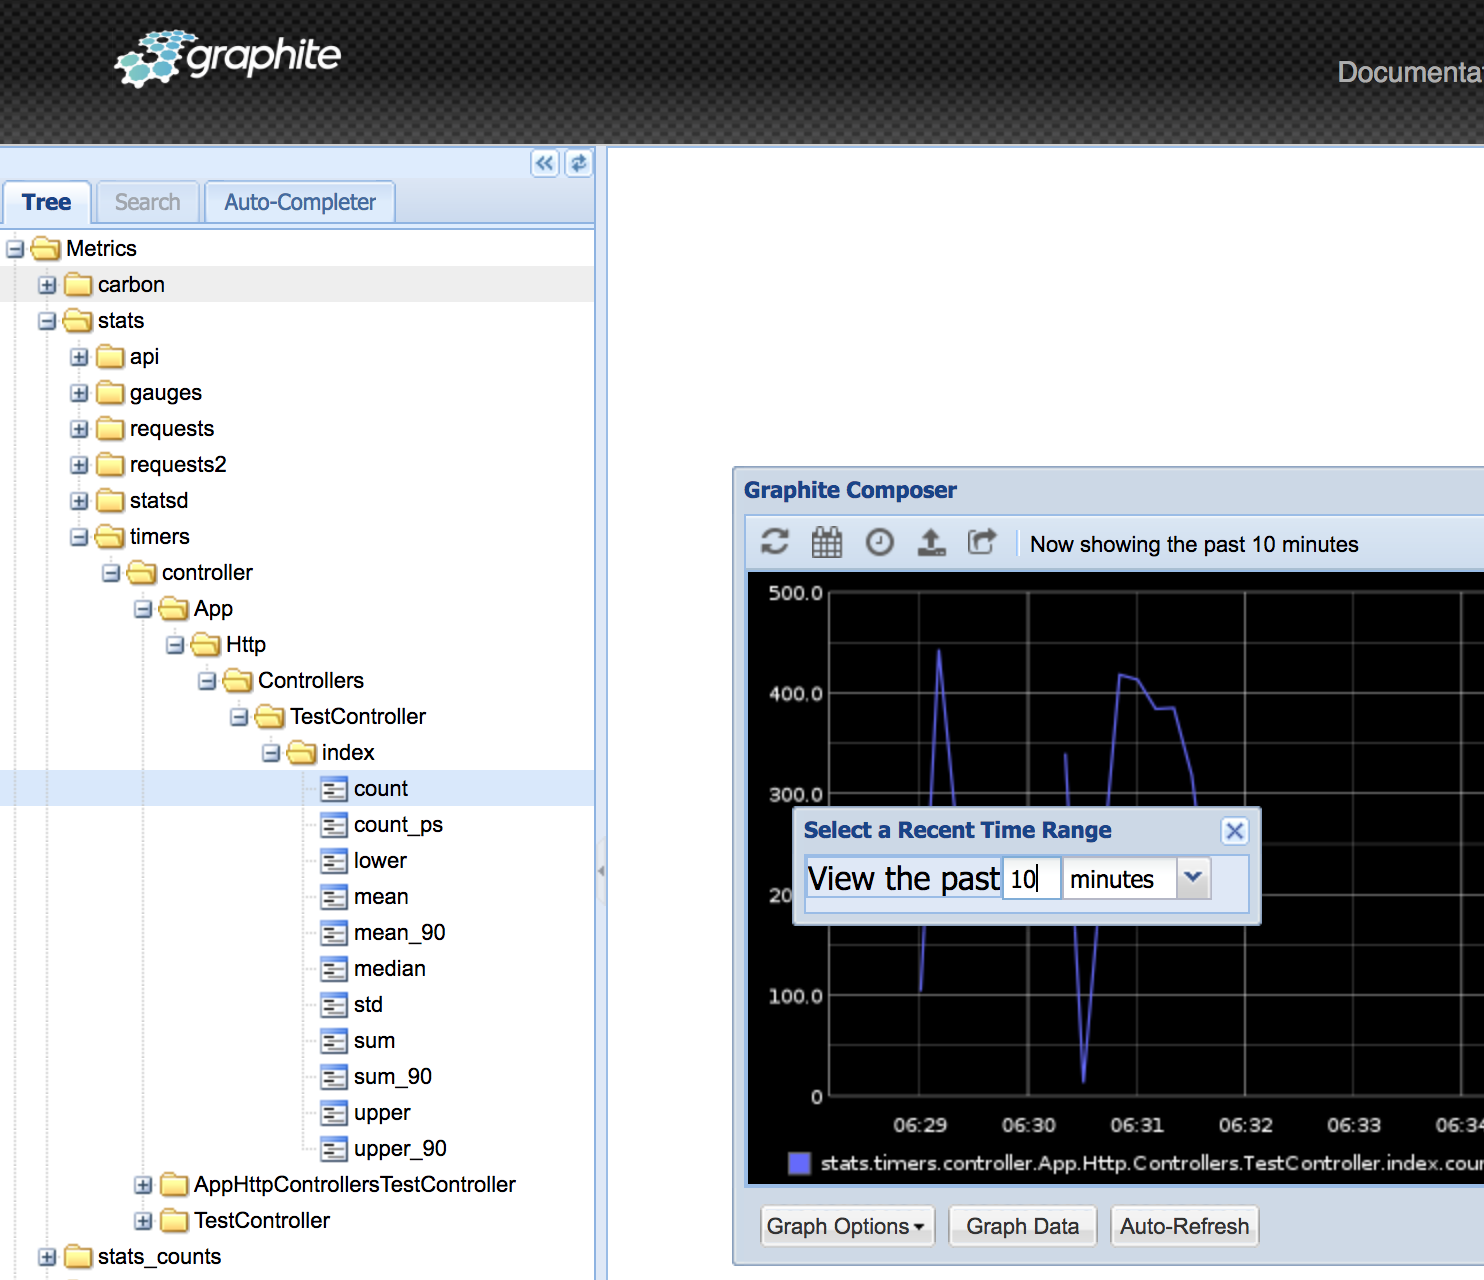
Timers give you various stats including percentiles, average (mean), standard deviation, sum, lower and upper bounds.
Learn More
Well, that’s it for our whirlwind tour of using StatsD with Laravel. If you’ve never instrumented code, I hope that you practice and hopefully one day get something out into production!
I find that StatsD is invaluable in working with legacy systems so learning how to instrument your code has great returns for your investment.
I recommend that you get familiar with the different metric types that StatsD supports (Gauges and Sets are cool).
As far as reading up on the instrumenting of code, I highly recommend that you read Measure Anything, Measure Everyting, the original Etsy blog post introducing StatsD. Also, Counting & Timing on the Flickr blog was an even earlier description and implementation of the ideas behind StatsD.