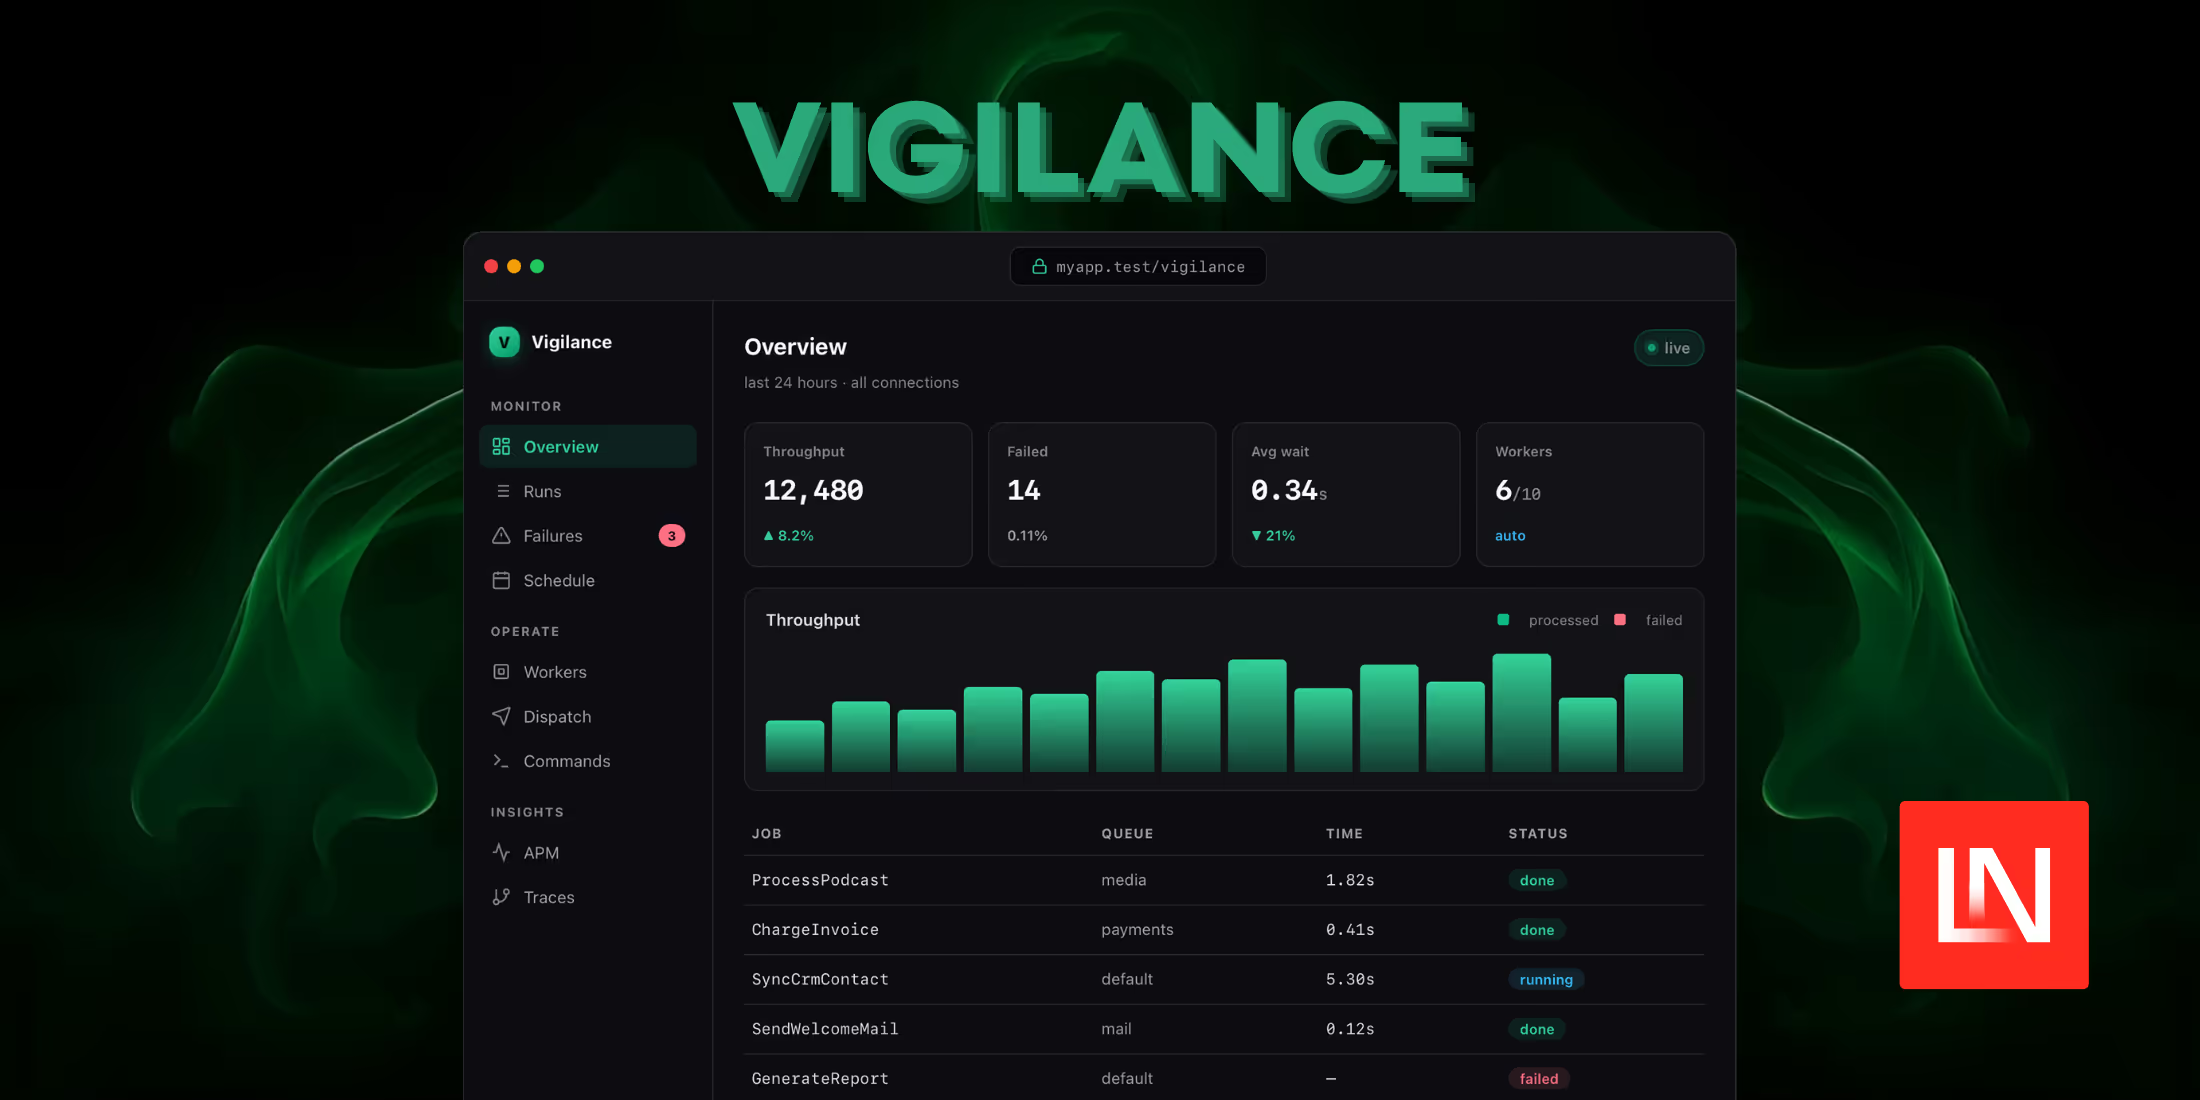
Vigilance is a monitoring dashboard that tracks how your background work actually behaves in production. It records jobs, artisan commands, and scheduled tasks as they move from queued to running to done or failed, capturing parameters, exit codes, and exception traces along the way. The part that sets it apart from existing tools is that it does not care which queue driver you run: database, Redis, SQS, Beanstalkd, and sync all reports into the same place. It requires PHP 8.2+, Laravel 12 or 13, Livewire 3.5+ or 4, and is MIT-licensed.
One Record Per Run, Across Every Driver
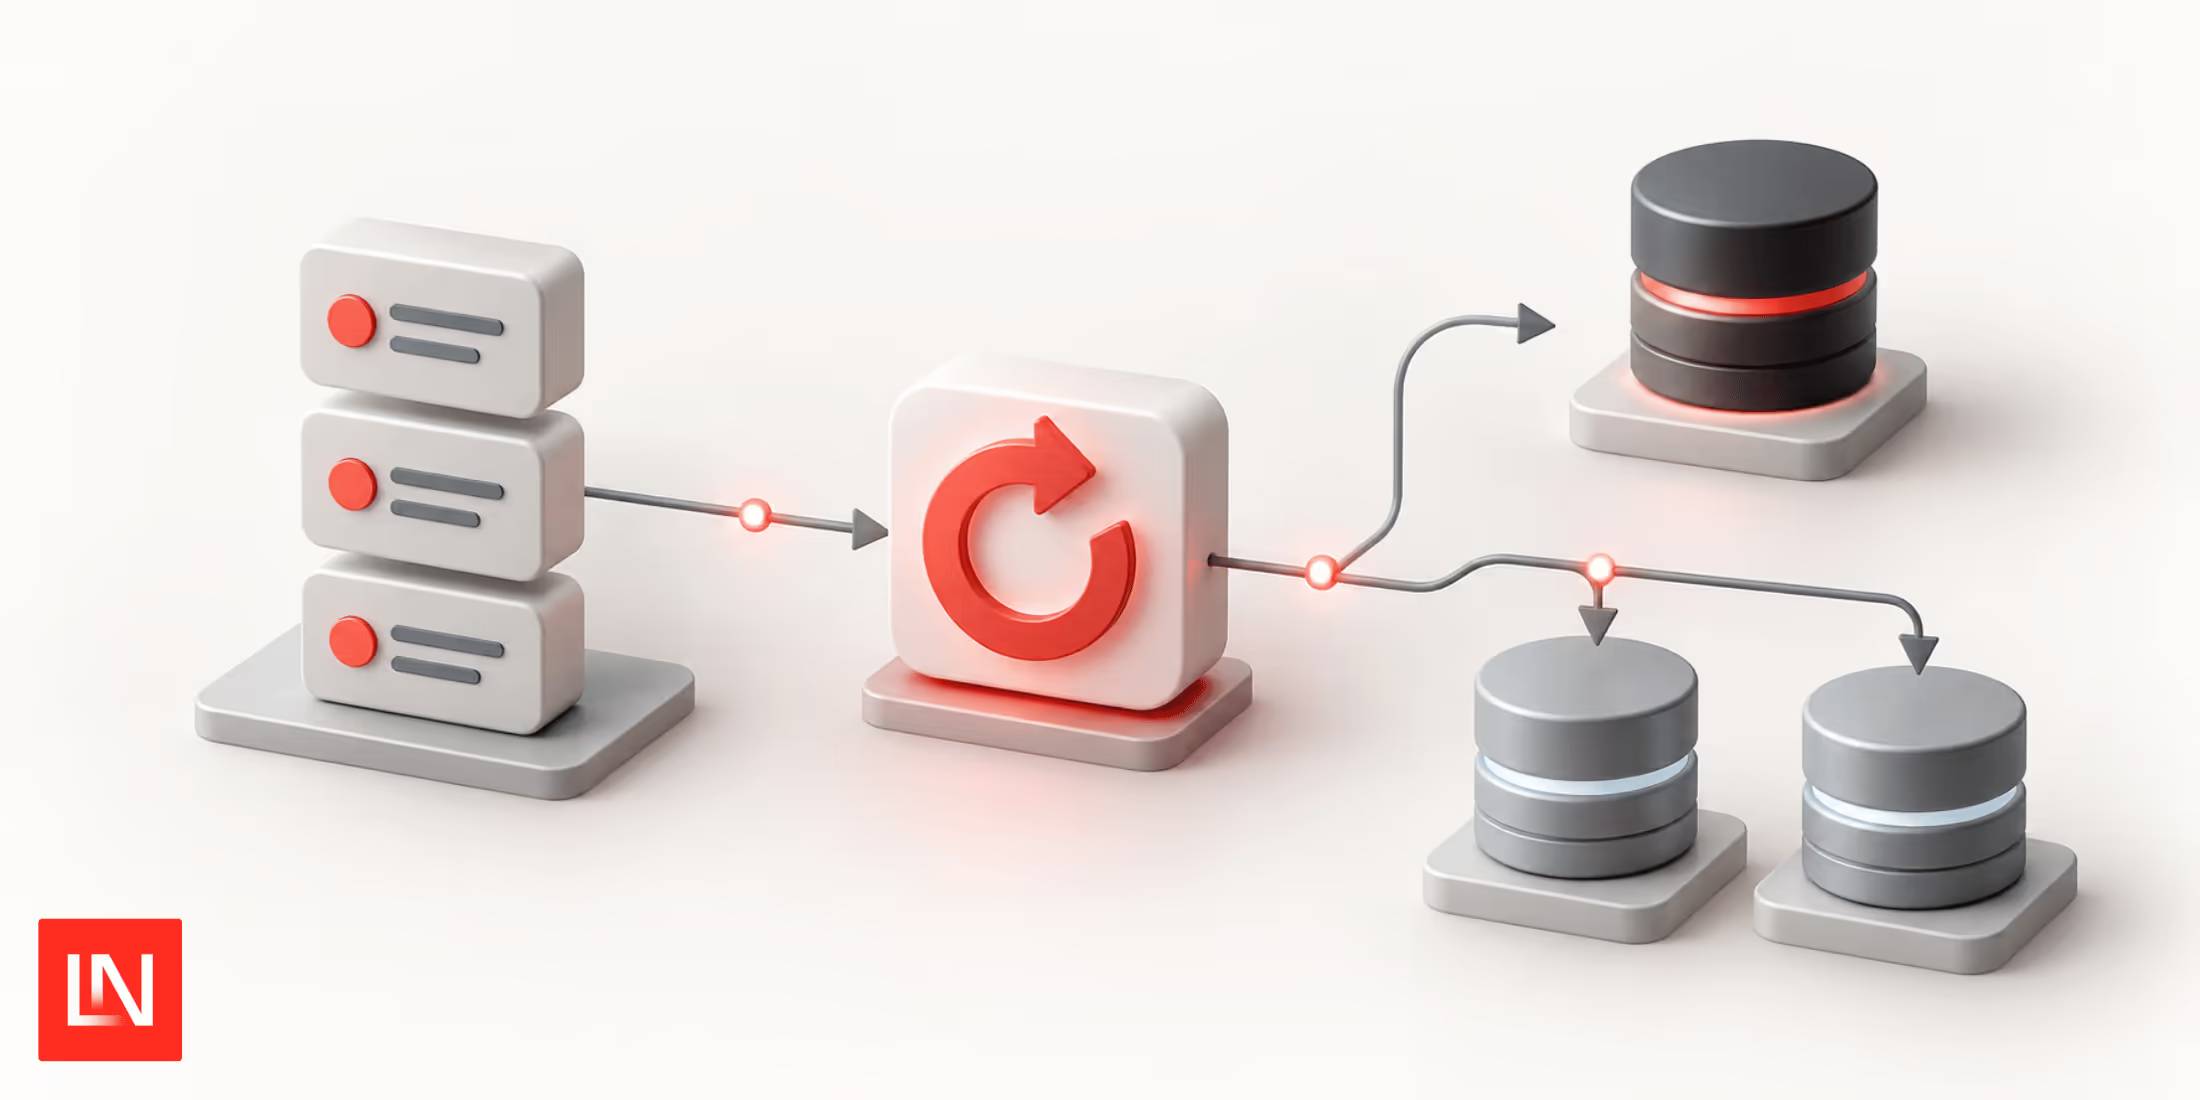
Horizon only watches Redis queues, and Telescope is built for local debugging rather than production. Vigilance instead writes a single row for each run and updates it throughout the run's lifecycle, so you end up with a single timeline that covers queued jobs, CLI- or scheduler-invoked commands, and the scheduler itself. Each record contains the execution parameters, the final state, and a redacted exception trace when an exception is thrown. Secrets are stripped automatically before anything is stored.
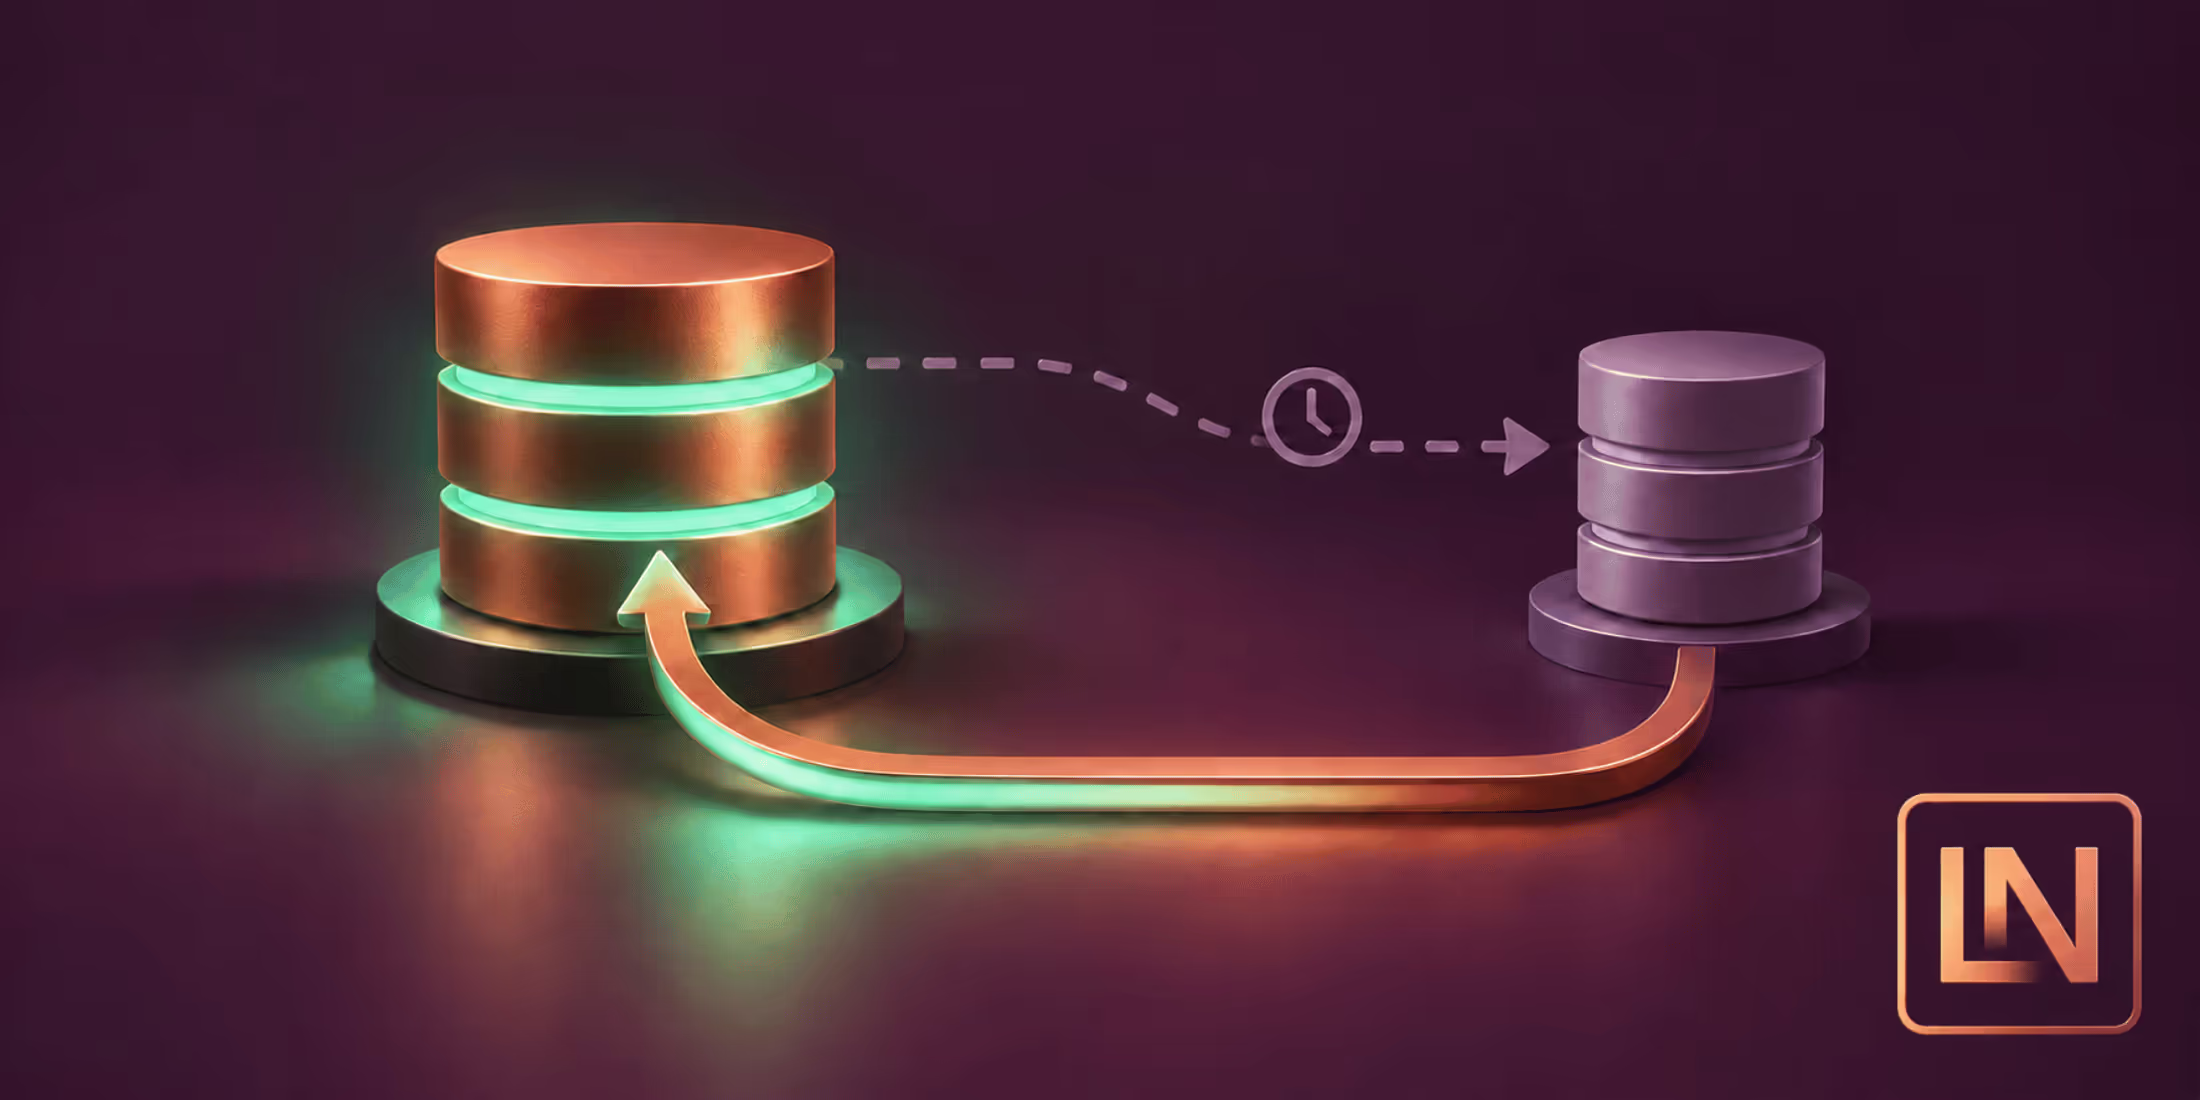
Because storing every successful run gets expensive, Vigilance samples at dispatch time and keeps failures regardless of the sample rate:
VIGILANCE_SAMPLE_RATE=0.1VIGILANCE_RETENTION_DAYS=7VIGILANCE_DB_CONNECTION=monitoringKeeping 10% of successful runs while retaining all failures keeps the volume manageable on a busy queue, and pointing VIGILANCE_DB_CONNECTION to a separate database isolates monitoring writes from your application's primary connection. Pruning runs on a scheduled command driven by the retention setting.
Manual Dispatch From Typed Forms
When you opt in to the control features, Vigilance can dispatch jobs straight from the dashboard. You mark a job with the Dispatchable contract, and the dashboard reads the constructor signature through reflection to build a form for it:
use Vigilance\Contracts\Dispatchable; class ProcessPodcast implements ShouldQueue, Dispatchable{ public static string $vigilanceLabel = 'Process a podcast'; public function __construct(public Podcast $podcast, public bool $notify = true) {}}The generated form handles scalars, enums, dates, and Eloquent model binding, so a constructor that expects a Podcast model produces a field that resolves the record for you. The same mechanism runs allowlisted artisan commands from the UI. Both capabilities are off by default and gated behind a config flag:
VIGILANCE_CONTROL_ENABLED=trueCustom Metrics and Core Web Vitals
Alongside the run history, Vigilance collects two kinds of application data. Business metrics use a counter and gauge API you call from your own code:
use Vigilance\Vigilance; Vigilance::increment('signups');Vigilance::gauge('cart_value', $cart->total());For frontend data, enabling Real User Monitoring (RUM) and adding a Blade directive to your layout collects Core Web Vitals (LCP, INP, CLS, FCP, TTFB) from real visitors:
VIGILANCE_RUM=true@vigilanceRumThese feed the dashboard's performance views, which report p50, p95, and p99 latencies and error rates next to the queue and command timelines.
Installation and Securing the Dashboard
Install the package, run the installer, and migrate:
composer require anousss007/vigilancephp artisan vigilance:installphp artisan migrateThe dashboard is local-only until you explicitly authorise access. Define who can see it with a callback in a service provider's boot() method, or with a Gate:
use Vigilance\Vigilance; Vigilance::auth(fn ($request) => in_array($request->user()?->email, [ 'you@example.com',]));From there, it lives at /vigilance by default.
That covers the core of what Vigilance records, but the dashboard goes beyond queue history. It groups exceptions into a fingerprinted issues inbox spanning web requests, queued jobs, commands, and the browser, tracks service-level objectives with error budgets and burn-rate alerts, and watches release health by comparing error rates before and after a deploy. Other optional pieces include request and job tracing with per-request waterfalls and N+1 detection, uptime checks that record availability and latency, a searchable log explorer correlated to traces, alerting to Slack, Discord, Teams, or a webhook, a worker supervisor that fills Horizon's role for non-Redis drivers, and read-only AI agent access over an MCP server.
You can read the documentation and source on GitHub.