Scout APM is a Laravel application performance monitoring tool that ties performance anomalies directly to endpoints, saving developers hours of time spent on troubleshooting and debugging.
Scout recently expanded its service offerings to include microservices and managed service monitoring for PHP applications, giving you more cohesive and actionable observability metrics. Learn more about how to monitor a laravel application with Scout APM by reading below.
Setup
To get started monitoring your Laravel applications you will first of all need a Scout account. If you don’t have one already, you can sign up for a free 14-day free trial (no credit card required) here.
The next thing to do is to add the low-overhead monitoring agent to your project’s dependencies, this can be done with a single command in your shell:
composer require scoutapp/scout-apm-laravelThis command will install two packages: scout-apm-laravel and scout-apm-php. The next thing to do is to define some configurations settings to link the agent to your account. To do that, open up your project’s .env file in your favourite text editor and add the following three lines to the end of the file:
SCOUT_MONITOR=trueSCOUT_KEY=”enter your Agent Key here”SCOUT_NAME=”enter the name of you application here”You can find your account’s Agent Key on the settings page of Scout. And that’s it! Deploy, and after approximately 5 minutes, your data will start to appear in Scout. For more information about Heroku installs or to troubleshoot installation problems, either take a look at the documentation or shoot an email to support@scoutapm.com and we’ll be happy to help.
Where to start?
So you’ve created a Scout account, hooked up the monitoring agent, but where do you start with diagnosing your application’s performance issues? Let’s take a look at the main features of Scout which can help you to understand your performance issues quickly.
The main overview page
The first page that you are presented with when you log into Scout is the overview page (shown below) which gives you a clear, clutter-free, snapshot of the health and performance of your application in one quick glance.
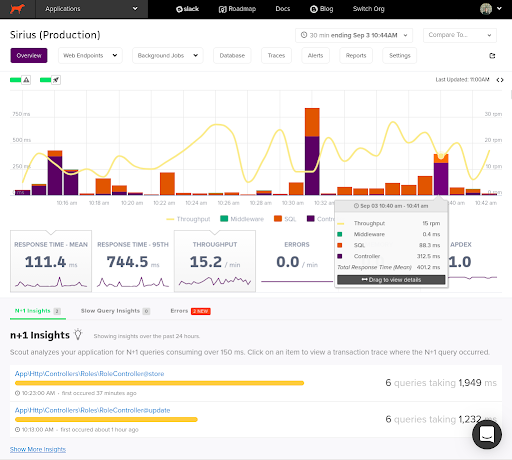
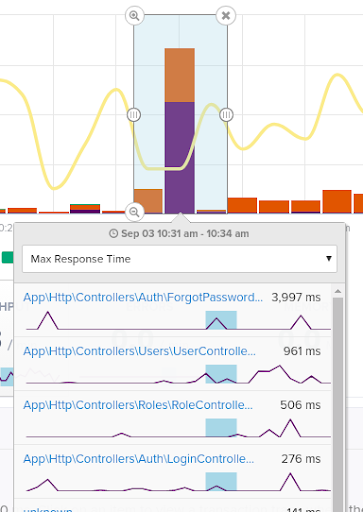
The chart is highly configurable, allowing you to change the time period and toggle which metrics you want to see. It also features a neat drag-and-drop tool (shown below) that allows you to draw a box around areas you wish you explore in more detail. A pop-up window will dynamically load as you draw these boxes, showing all the endpoints that were accessed during this time period. This can be particularly useful when you see a performance spike on the chart and you want to see what caused it.
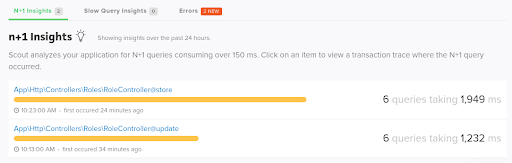
Insights tabs
A great place to start if you are trying out Scout for the first time are the insights tabs. Here we have a set of algorithms which analyze your project to identify potential n+1 queries and slow queries. These offer you the “low-hanging fruit” of performance fixes that can often instantly improve your application’s performance.
Endpoints and Traces
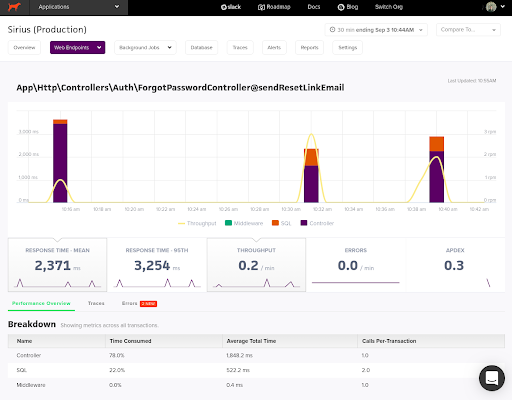
Scout primarily provides application performance metrics at two levels. First of all, from the perspective of an Endpoint. For example, on average, how long does this endpoint take to access and what is the breakdown of where time was spent?
If you take a look at the screenshot below, you can clearly see that on the 3 occasions that this ForgetPasswordController endpoint was accessed 78% of the 2,371ms mean request time was spent in the controller layer indicating that would be the first place to investigate if we wanted to try to improve this sluggish endpoint.
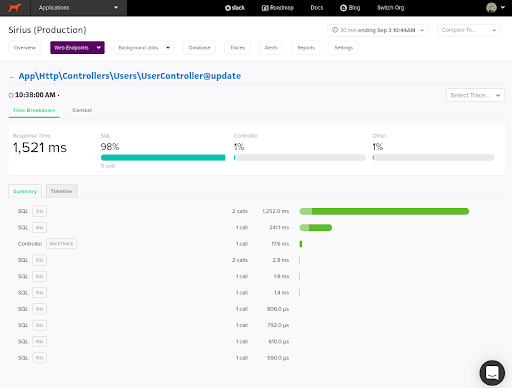
The second perspective that Scout primarily presents metrics from is at the Trace level. For example, during this particular web request that somebody made, how long did it take to complete, and which levels of the request consumed the most time etc. Looking at the trace of the update action of the UserController below, we can see that in this case 98% of time was spent in the SQL layer, and most of this time was spent in those 2 calls to the query on the top line. If we click that SQL button we can see a backtrace and see if we can perhaps improve the query.
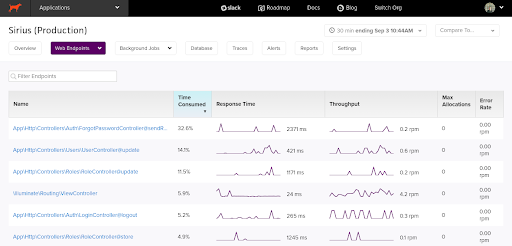
These pages are where you will spend most of your time in Scout, and they give you the sort of visibility that is essential when trying to understand your performance issues. You can reach Endpoint and Trace pages either by coming directly from the main overview page and insights tabs, or by clicking on the Web Endpoints link at the top of the page (shown below).
Beyond the basics
Now that we’ve covered the basics of Scout and shown you the main areas of the system that you would typically use day in, day out, let’s now switch our attention to some of the more advanced features which put Scout ahead of the crowd in the APM space.
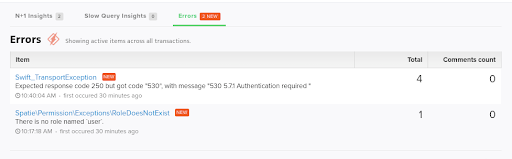
Error Monitoring
Whether you are using Sentry, Honeybadger, Bugsnag, or Rollbar for your error monitoring, then we have you covered! Scout integrates seamlessly with these popular services, allowing you to have all your monitoring in one place, on the main overview page.
The setup process is similar regardless of which of these services you use, and all it involves is adding the API token on the settings screen of Scout.
Custom Context and Trace Explorer
Why does this performance issue only happen at 2:00AM on Tuesday night from a Brazlian IP address? These kinds of difficult (but common) performance issues can be tackled with one of the most powerful features of Scout: the trace explorer being used in conjunction with user defined custom context.
Used defined custom context allows you to tell us what you need to see. And it is well worth investing the relatively small amount of time it will take you to set up to be granted monitoring superpowers! By default the only context fields you will see are URI and Hostname, as you can see below, but these can be customized to anything that you want.
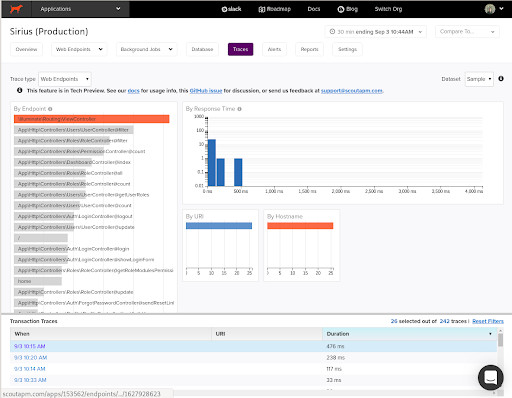
The trace explorer’s multi-filter charts (shown above) allow you to examine endpoints that match criteria that you have defined, and then you can see all the traces that match these filters in the Transaction Traces part of the screen. For example, perhaps you want to see the web requests of a certain user, or of all users on a certain plan size, or from a certain part of the world. These sorts of operations are easy to do in the trace explorer with custom context, and they help you to get to the bottom of those hard-to-diagnose, time-consuming performance issues.
Deploy tracking
Did this performance issue that you are seeing suddenly start happening after the last deploy? What is the user experience like during the time that you deploy? These are the types of questions that can be answered with our deploy tracking feature, which will place a rocket symbol on the main overview chart to indicate when a deployment occurred.
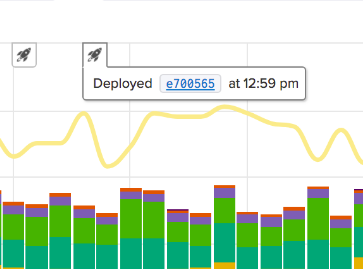
Deploy tracking also allows you to see details such as how many commits were involved in the deploy and which branch the commits came from. We can glean all this information when you add the SHA or your deployment to the SCOUT_REVISON_SHA environmental variable.
Alerting
Like all good monitoring solutions, Scout provides you with a sophisticated alerting system which can be configured to send certain people alerts when endpoint response times or memory usage metrics go over a certain threshold. These alerts will appear as warning symbols on the main overview chart, and notifications will be sent out.
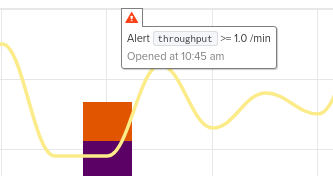
By default, the alerting system will send notifications to users in notification groups via email, but it can also be configured to work with third party services such as Slack, VictorOps, PagerDuty etc. with our webhook feature.
Custom Instrumentation
Are you using libraries outside of Laravel that we don’t currently instrument? If so, then first of all let our support team know and we’ll try and get support added for you. And in the meantime you can add some custom instrumentation yourself, it’s really easy to get started, and it will ensure that you have full visibility of your whole application.
What’s next?
As you can see Scout APM brings a very mature APM monitoring solution to the PHP and Laravel communities. Our clutter-free UI and deep instrumentation help you get right to the heart of your performance issues quickly, whilst remaining affordable due to our flexible transaction-based pricing structure.