The final stage of the popularSoftware Development Lifecycle after planning, analysis, design, and implementation is maintenance. This is where a full-fledged application running in production is constantly looked after and taken care of. Bugs, bottlenecks, slow database queries, security loopholes, and other issues are discovered and fixed before deploying the updated code.
Log records and Application Performance Monitoring (APM) tools play a crucial role in software development maintenance. Both enable developers and organizations to understand how their applications are internally operating, how they are playing out on the internet, and how the end-users are receiving them.
You've likely been logging and are aware of its advantages but might not have tasted the APM sauce. Or, you may have heard of APMs, but did not consider getting one for your setup (assuming log records alone would be sufficient). Either way, you should consider using both – performance monitoring and logging tools for monitoring and maintaining your application.
Here's an outline of what we'll be covering so you can easily navigate or skip ahead in the guide –
- What is the Difference Between Logging and Monitoring?
- I Have Logs and Metrics Data - Why Do I Need an APM Solution?
- Is Application Monitoring Right for My Business?
- Get Started Monitoring Your Application's Performance
What is the Difference Between Logging and Monitoring?
Application logging and monitoring systems are similar in that they are indispensable analysis tools that allow you to peep into the workings of your application. However, both do so differently — each tells you only one side of the story. Let's dive into them one by one and understand how.
What is Application Performance Monitoring (APM)?
Application Performance Monitoring (APM) refers to the automated process of monitoring the many aspects of a web application's performance — those that usually matter the most to your user's experience. This includes a whole suite of metrics covering user experience (UX) and the system's resource utilization. These are often the effects and causes (respectively) of issues in several applications.
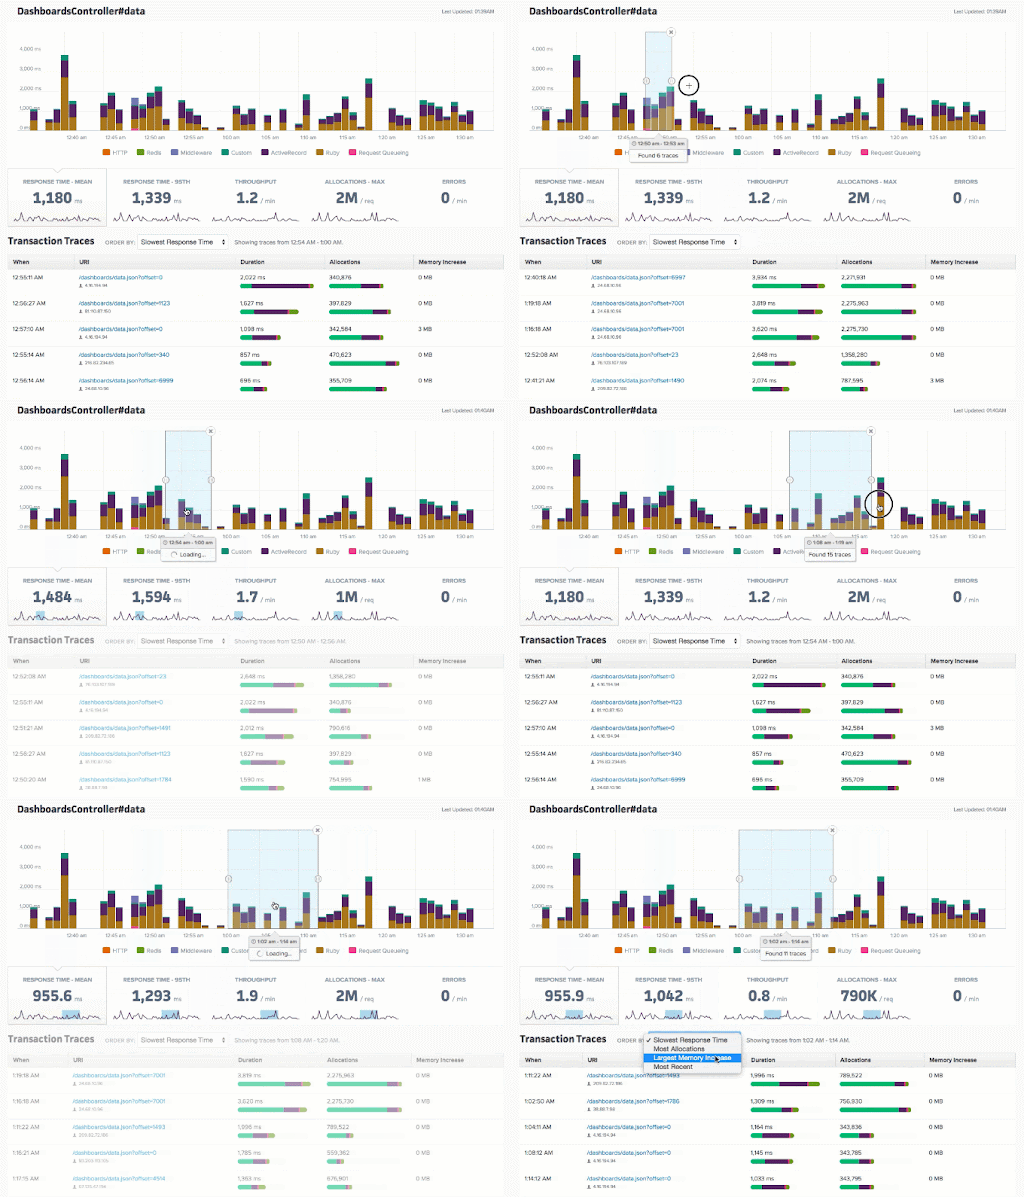
These metrics include request volumes, response times, latency, throughput, system metrics like CPU, memory, and storage information, and so much more. Additionally, these tools offer features like full-stack code traceability (integrated with Github), bottleneck identification, slow database queries, memory bloat and leaks, real-time alerts, custom notification channels, 24 x 7 tech support, fancy customizable UI dashboards, and more. Combined, all of this can give you a complete picture of how your application is faring.
It isn't challenging to identify a sluggish application when you see one. What is difficult is to be able to pinpoint the exact component that's pulling your application down; for example, a single HTTP endpoint that's taking the most time, a slow database query, a memory leak in your code, an overloaded processor, limited memory, etc. APM tools allow you to surface these very troublesome aspects of your infrastructure and present actionable insights about solving these in an easy-to-understand way.
To get a sense of what a state-of-the-art APM tool looks like, check out Scout APM. To dive deeper into a comprehensive study of what APM tools offer, check out our blog's 'Application Performance Monitoring - What is APM?' article.
What is Logging and Log Management?
We've all logged data before when we code — whether it's for displaying values of state variables, debugging code, or tracking the progress of events and actions in our program.
In terms of managing applications running in production, logging also refers to the same practice of printing, writing, and recording information about events in your application's life cycle. This established best practice enables developers and organizations to keep track of information about your application's state, actions, and environment configurations over time — as potential checkpoints that can later be investigated for maintenance, debugging, and security purposes. It, therefore, helps to think of log records as a historical track sheet of your application's workings and its time catering to end-users on the internet.
Though there are ways in which we can use logging to measure and track application performance, the focus here isn't on performance as much as it is on collecting and recording information. This usually includes the following use cases for capturing different kinds of data —
- Compliance records: Organizations need to maintain log records for verifying and ensuring compliance with security policies, regulations, and audits.
- Investigating anomalous activity: Logging systems also allow you to dive deep into specific incidents of concern (e.g., data leak, security breaches, etc.) to get contextual as well as fine-grained information about the incident — for coming up with solutions, tracing development history (to get an estimate of when an issue surfaced), verify data transactions, etc.
- Debugging code: As we all know, logging (e.g., request, response payload) also plays a vital role in debugging during development routines.
I Have Logs and Metrics Data - Why Do I Need an APM Solution?
Having seen what all logging has to offer, you could be wondering – what value do APM solutions like Scout bring to the table? In this section, we'll try to develop a sense of the same.
The famous adage, "first impression is the last impression," applies equally (if not the most) to software products. First impressions are critical in capturing and retaining end-users for most software-based business ventures. Think about this – how often have you considered revisiting an application that was sluggish the first time you used it? How often would you give it another chance? Quite rarely, I suppose. You're much more likely to go ahead with an alternate service provider that's quicker.
Each impression is as important as the first one when it comes to software. Even one day can hurt your application's reputation and risk losing your customers to your competitors. When the stakes are this high, you can't afford to leave any stones unturned to offer the quickest service to your users.
APM tools help you take a step in this very direction. After creating your dream application, you want to deliver it to its maximum potential. However, the inherent complexity of the collaboration between the various moving pieces involved in running your application makes it challenging to monitor each aspect of its functioning. Therefore, even the minutest of miscalculations (e.g., system requirements based on user traffic estimates) can significantly hamper the user experience.
APM tools not only provide you with real-time insights and alerts about the current health of your application but also foresight into which pieces (e.g., end-points, code lines, system hardware, etc.) might fail you when traffic increases and how to optimize them. These tools help you deal with the dynamic (and often turbulent) nature of an application's time on the internet in an automated fashion, allowing you to make fixes before the user catches wind of any issue. This is where APM tools shine instead of hefty static log files (that serve a different purpose).
Because Log Records are Hefty
It is no surprise that log files are pretty large and therefore challenging to maintain and track. With tens of thousands of lines, most of these files can get out of hand pretty soon and become intractable to work with. Moreover, storing these files is an additional overhead. If log systems are not carefully implemented, these records can take up significant storage space on your servers and therefore add to your bills.
On the other hand, Application Performance Monitoring can capture trends (with or without logs) that can save you from having to skim through thousands of lines of logs to get valuable information. These tools can help you cut through (often) nebulous, cluttered blobs of text and present actionable insights for optimizing performance right away.
Note: This is not to say that the logs aren't helpful; log records have their own essential use cases. APM tools just provide an additional lens to investigate how your application is faring on a higher level.
For Keeping Track with Multiple Log Streams across Distributed Systems
As organizations move towards containerization and microservices-based web applications, developers and QA engineers need to track and manage log streams from multiple microservices for a single application. As a result, locating an entry across numerous streams of lengthy records (and keeping up with them) can be a struggle.
Modern, microservice-aware APM tools can help in condensing all of this information into an integrated interface for users to be informed about their infrastructure.
For Automated, Real-Time Alerts (through your preferred channels)
Even seconds of application downtime can cause a significant dent in your business. However, assigning personnel to manually 24 x 7 monitor issues isn't a viable option. APM tools offer a more practical solution with their automated monitoring systems.
APM tools can prevent such catastrophes with their real-time alerting mechanisms by alerting you a.s.a.p (if not beforehand) of potential issues. This can include alerts about failures, memory bloat, leaks, bottlenecks in performance, unprecedented spikes in user traffic, etc.
Here's a helpful analogy between log records and CCTV footage in security facilities.
Log records alone are equivalent to CCTV footage of security breaches. They are useless in isolation unless there's a mechanism to bring the relevant event to the attention of the concerned parties.
Source: Scout APM Blog (Logging and Monitoring: A Match Made in Heaven)
Additionally, APM tools like Scout allow you to integrate with services like Slack, Zapier, OpsGenie, PagerDuty, etc., and create Webhook end-points for receiving real-time alerts. This is quite convenient for organizations to integrate into existing workflows used by their teams to communicate and collaborate.
For a Convenient Summary of Application Performance
As we hinted at before, APM tools can help in condensing metrics and records into neat user interfaces that summarize your application's performance — metrics that matter the most to your setup. These tools can quite clearly communicatea high-level overview of your application's health through fancy, customizable UI dashboards with easy to interpret graphs.Below is a sample overview of Scout's dashboard, showing insights into our website's performance in production.
Note: APM tools don't only focus on the high-level stuff. They can also go into the fine-grained, low-level information — to the very line of code causing issues through features like full-stack code traceability.
So many more features!
We've only barely scratched the surface of the many features that APM tools offer. Here are some more — real-user monitoring, database monitoring, network, and infrastructure monitoring, deployment benchmarking, AI-based analysis, full-stack observability, code-level performance profiling, N+1 queries detection, detailed stack traces, custom metric calculations, and whatnot.
Is Application Monitoring Right for My Business?
If you prioritize application performance and end-user experience, an APM tool is a no-brainer for your business.
Schedule a Scout demo today, or get in touch with us to know more about how our product can suit your needs.
Get Started Monitoring Your Application's Performance
In this post, we talked about the difference between logging and monitoring systems, discussing why log records alone wouldn't be enough. Now that hopefully you are convinced of the virtues of APM tools alongside logging systems, go ahead and rethink what should constitute your monitoring toolkit.
The increased understanding of how end-users receive your software product will enable you tomake informed decisions, solve issues proactively, optimize performance, and get the most out of your applications; all of this and more so you can spend less time debugging, and more time building.
Our Scout APM tool now also includes support for error monitoring. Try Scout APM + Error Monitoring with a 14-day free trial (no credit card needed!).

