Taylor Otwell recently made a post comparing the code complexity between Laravel and other frameworks. The tool he used to generate these reports is called phploc and it’s very easy to run on your own code base.
I decided as a means of comparison I would run that on the codebase for this site and just see what the results are.
phploc
First, install the composer package either your require-dev or globally:
composer global require 'phploc/phploc=*'Next, just cd into your application and run the phploc command:
phploc ./appThen it spits out the results. Here is what the app directory for Laravel News looks like:
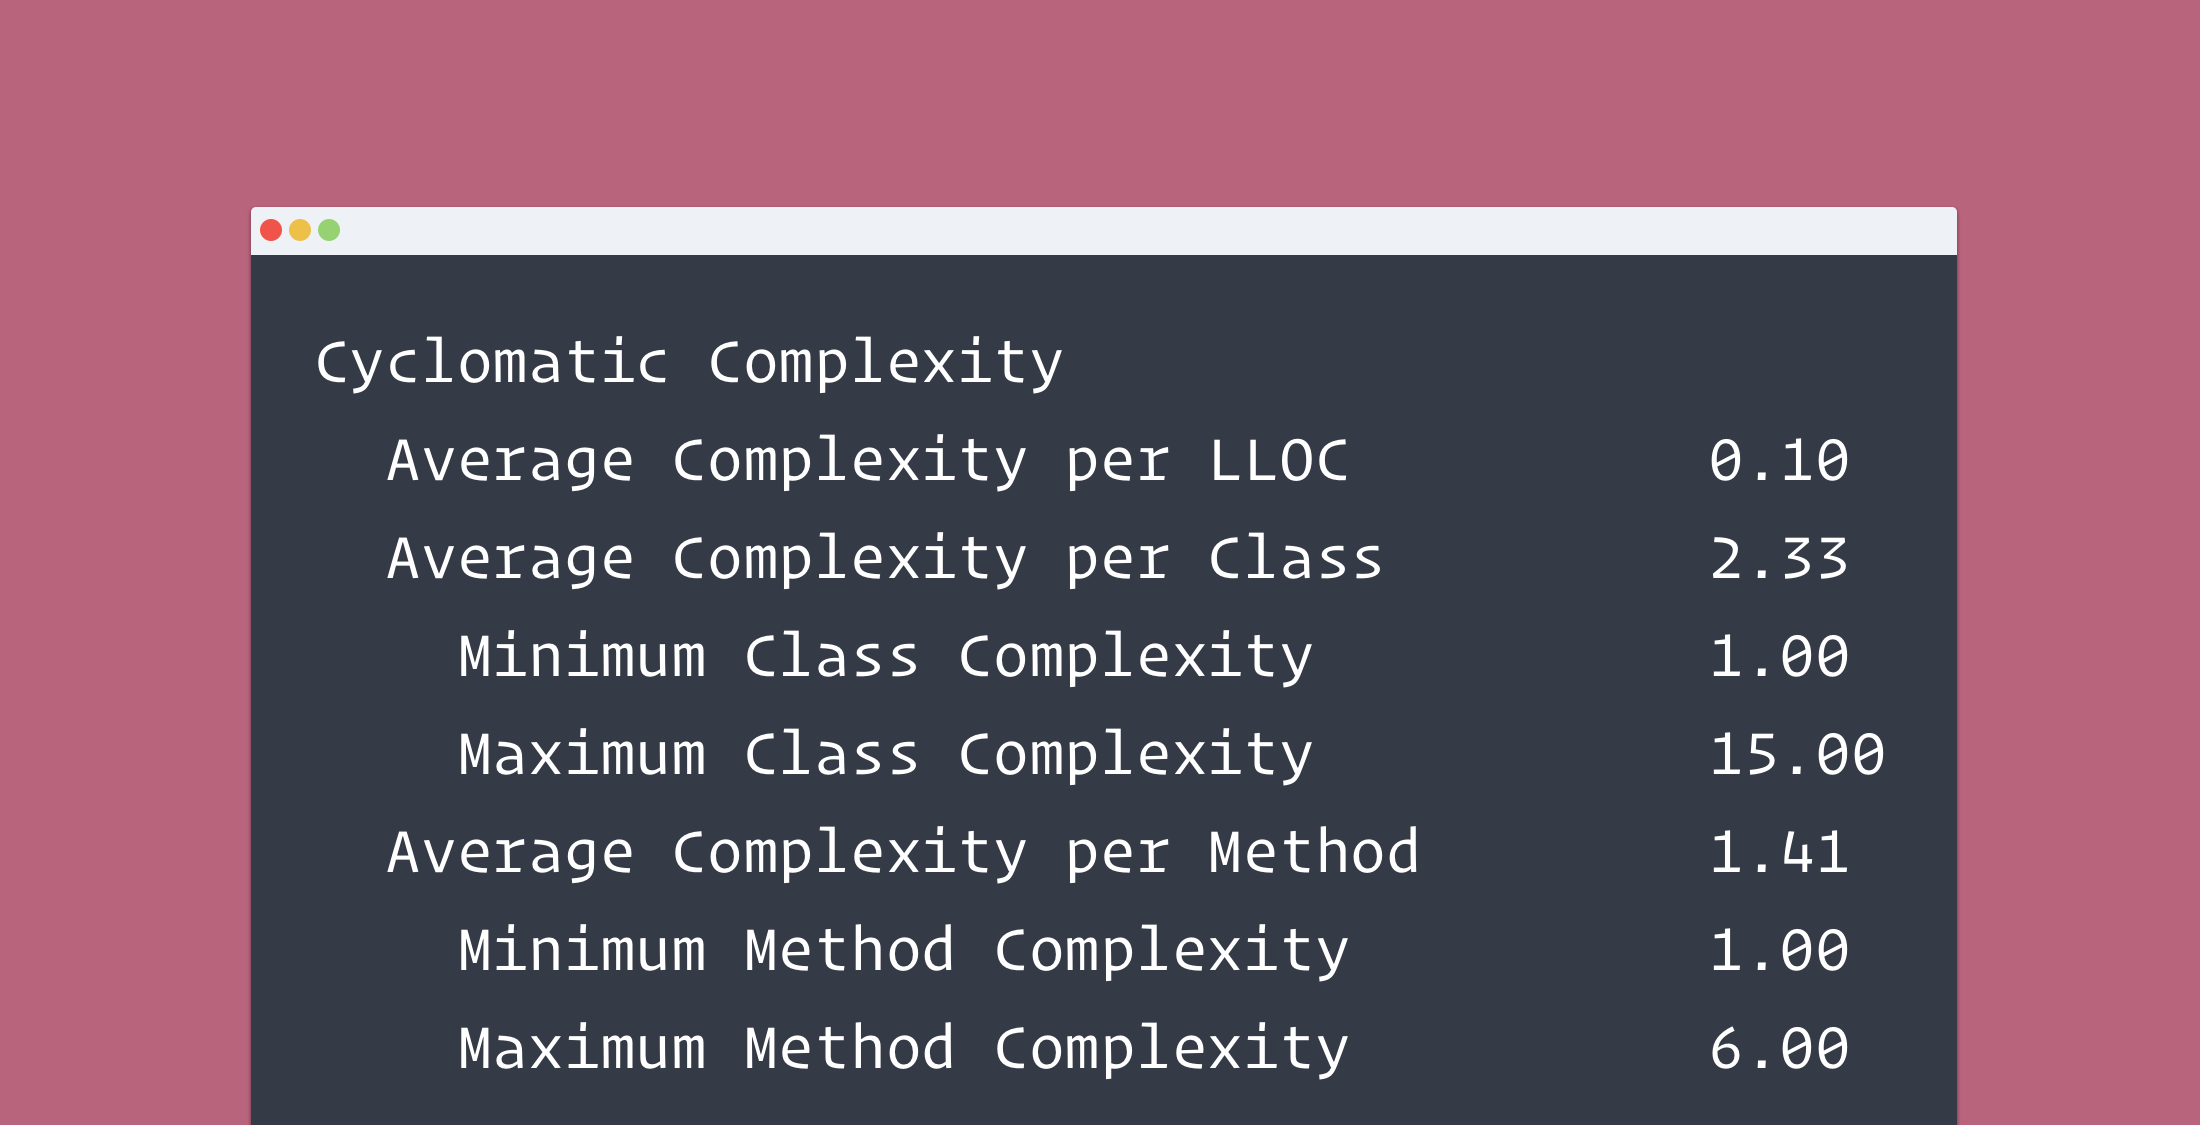
phploc 3.0.1 by Sebastian Bergmann. Directories 14Files 72 Size Lines of Code (LOC) 3748 Comment Lines of Code (CLOC) 790 (21.08%) Non-Comment Lines of Code (NCLOC) 2958 (78.92%) Logical Lines of Code (LLOC) 950 (25.35%) Classes 656 (69.05%) Average Class Length 9 Minimum Class Length 0 Maximum Class Length 84 Average Method Length 2 Minimum Method Length 0 Maximum Method Length 21 Functions 0 (0.00%) Average Function Length 0 Not in classes or functions 294 (30.95%) Cyclomatic Complexity Average Complexity per LLOC 0.10 Average Complexity per Class 2.33 Minimum Class Complexity 1.00 Maximum Class Complexity 15.00 Average Complexity per Method 1.41 Minimum Method Complexity 1.00 Maximum Method Complexity 6.00 Dependencies Global Accesses 0 Global Constants 0 (0.00%) Global Variables 0 (0.00%) Super-Global Variables 0 (0.00%) Attribute Accesses 436 Non-Static 436 (100.00%) Static 0 (0.00%) Method Calls 570 Non-Static 412 (72.28%) Static 158 (27.72%) Structure Namespaces 15 Interfaces 0 Traits 0 Classes 72 Abstract Classes 0 (0.00%) Concrete Classes 72 (100.00%) Methods 233 Scope Non-Static Methods 226 (97.00%) Static Methods 7 (3.00%) Visibility Public Methods 194 (83.26%) Non-Public Methods 39 (16.74%) Functions 24 Named Functions 0 (0.00%) Anonymous Functions 24 (100.00%) Constants 0 Global Constants 0 (0.00%) Class Constants 0 (0.00%)The one downside to this tool is I was unable to have it give me the file name for the maximum cyclomatic complexity or the maximum method length. Another tool named PhpMetrics can be used to help you find these and let’s look at how it works.
PhpMetrics
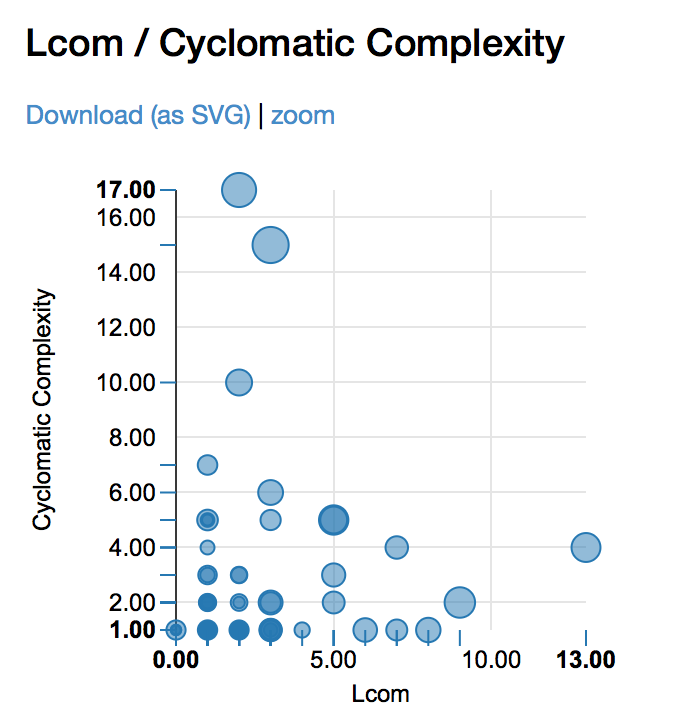
Another option if you want even more reporting and dig deeper into your codebase is PhpMetrics. It creates a nice HTML-based report complete with graphs and file-based reports.

Installing it is just as easy thanks to Composer:
composer global require 'phpmetrics/phpmetrics'Then, run the following to parse your app folder:
phpmetrics --report-html=myreport.html ./appAfter that runs, just open myreport.html in the browser and you can browse through its results.
Wrap Up
These are just two tools but many others exist and the two other most popular ones are phpmd, and php depend.
What I find great about these is these are not just vanity metrics but give you real insight on what part of your code base needs improvements and what may cause you problems later.


