Performance issues can be one of the most challenging to solve in real-world applications because they are not bugs. Performance issues often hide in database queries, leading to situations where the application works but just does not perform great.
Often, when a route is slow, the real issues are usually inefficient queries, a missing index, or an unexpectedly expensive aggregation. Problems like this are usually difficult to identify without proper monitoring.
In this tutorial, we will build a lightweight monitoring system for Laravel and MongoDB applications. The goal is to track database query performance and request duration so we can quickly detect slow operations and point developers to them.
Laravel and MongoDB are a powerful pairing because they combine a highly productive PHP framework with a database built for scale and flexibility. Using the official Laravel MongoDB package, you can use Laravel's expressive Eloquent ORM to manage data without the rigid constraints of a traditional SQL schema.
By the end of this guide, you will have a working system that:
- Tracks MongoDB query execution time
- Identifies slow queries automatically
- Logs performance data for later analysis
- Automatically cleans up old logs using TTL indexes
Pre-requisites
The following prerequisites are required to follow along with the tutorial:
- Development environment setup for Laravel and MongoDB
- Working knowledge of the Laravel framework
- MongoDB Atlas account
Understanding the Architecture
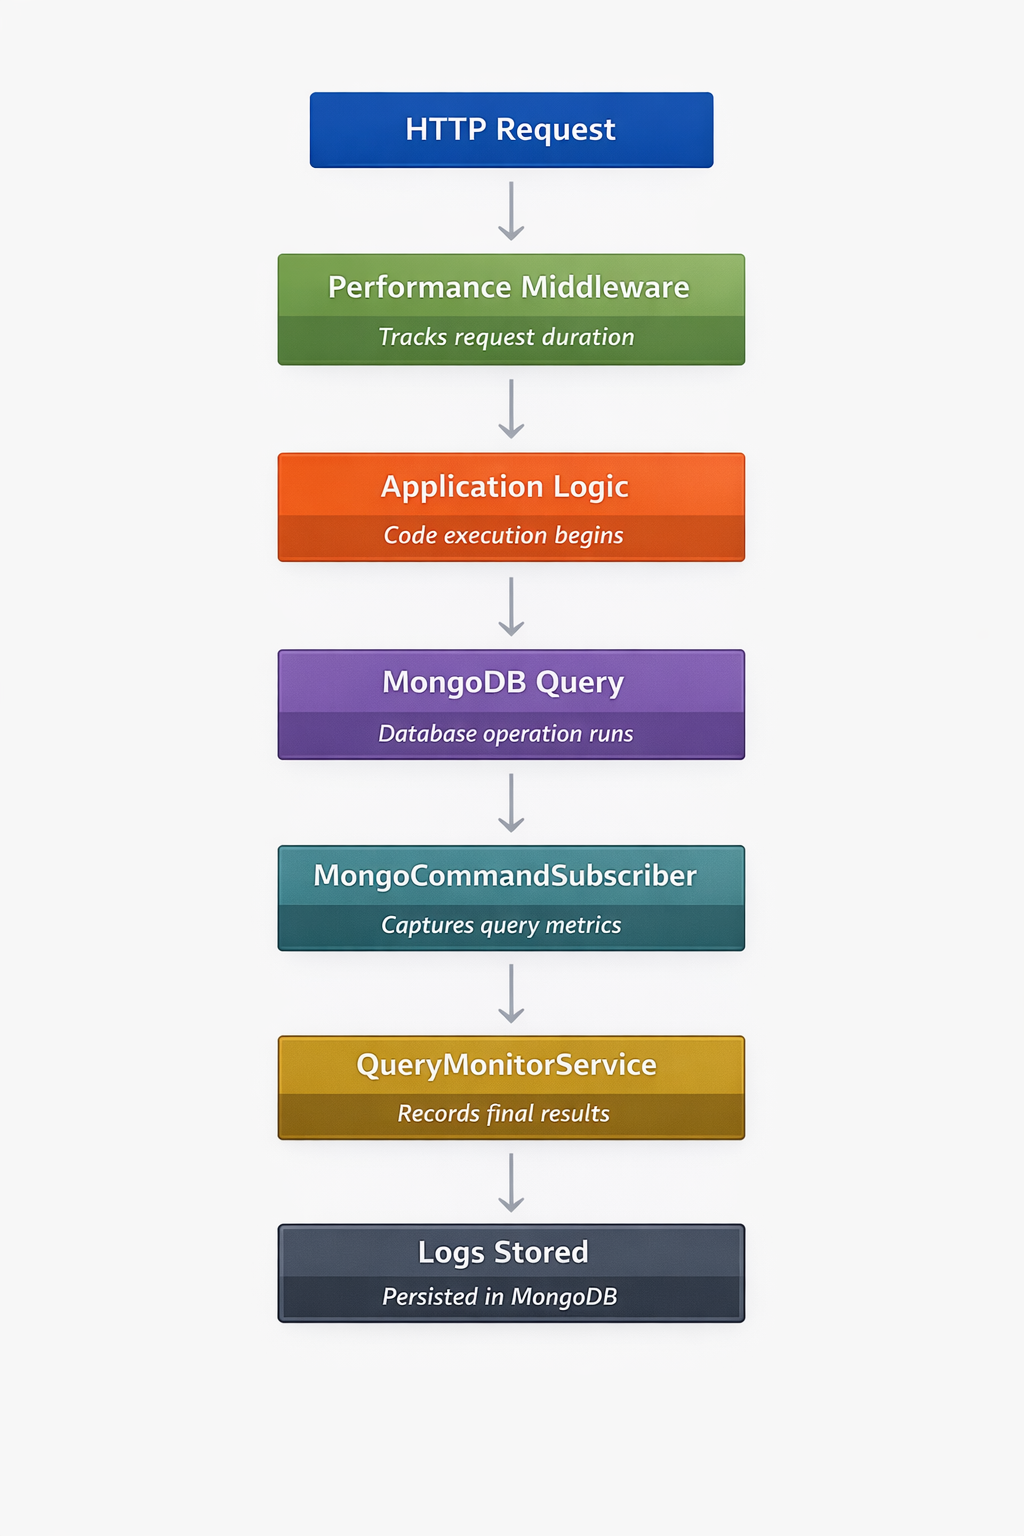
Let's take a moment to explore the flow of what we will build. The monitoring system would consist of two components: Request Middleware and MongoDB Command Subscriber.
Request Middleware
This is a custom Laravel middleware that we will create. It will accept requests from the client, measure the total duration of the HTTP request, and return insight into the time it takes from start to finish.
MongoDB Command Subscriber
We will create a PHP class that subscribes to the MongoDB PHP driver. The MongoDB PHP driver exposes a monitoring system that emits events whenever database commands are executed.
By subscribing to these events, we can capture query information, including the operation type (find, insert, aggregate), collection name, and execution time.
The image below shows the complete flow of the application from request to logging response in the MongoDB collection.
 Now we have a clear picture of what we want to build. Let's get started building it.
Project Setup
We will start by creating a fresh Laravel project using the command below:
composer create project laravel/laravel devrel-tutorial-customMiddlewareForQueryPerformanceWe need to configure the freshly created Laravel project to work with MongoDB. Ensure you have the MongoDB PHP Extension installed and added to your php.ini file. Follow the instructions in the MongoDB PHP driver installation guide if you need help with the installation.
Next, we need to install the Laravel MongoDB package to configure Laravel to work with MongoDB. In the project directory, run the composer command below to install it.
composer require mongodb/laravel-mongodbConfigure your .env File
We need to add your MongoDB Atlas connection details to the .env file. Log in to your MongoDB Atlas account and replace the MONGODB_URL below with your connection string.
MONGODB_URI="mongodb+srv://USERNAME:PASSWORD@cluster0.xxxxx.mongodb.net/?retryWrites=true&w=majority&appName=devrel-tutorial-customMiddlewareForQueryPerformance-laravelnews"MONGODB_DATABASE=devrel-mongodb-driversConfigure config/database.php
We also need to add the MongoDB configuration to the details in config/database.php. Open the file and add the code below to the connections array:
'mongodb' => [ 'driver' => 'mongodb', 'dsn' => env('MONGODB_URI'), 'database' => env('MONGODB_DATABASE'),],Also, set the default database connection variable to MongoDB like so:
'default' => env('DB_CONNECTION', 'mongodb'),Once configured, the Laravel application should be able to connect directly to your MongoDB Atlas cluster. Let's start building.
Creating a Post Model for Testing
We need a way to test the tracker. For this reason, we will create and seed a Post model to create some dummy data to test with. Let's proceed by creating the Post model, factory, and seeder with the command below:
php artisan make:model Post -mfThis generates the model, factory, and seeder files. Update app/Models/Post.php and replace the code with the code below:
<?php namespace App\Models; use Illuminate\Database\Eloquent\Factories\HasFactory;use MongoDB\Laravel\Eloquent\Model; class Post extends Model{ use HasFactory; protected $connection = 'mongodb'; protected $collection = 'posts'; protected $fillable = [ 'title', 'body' ];}We simply modified the class to connect to MongoDB, use or create a posts collection, and declared the $fillable items.
Seeding Sample Data
Next, let's define the factory to generate sample records. Update database/factories/PostFactory.php with the code below
<?php namespace Database\Factories; use App\Models\Post;use Illuminate\Database\Eloquent\Factories\Factory; /** * @extends \Illuminate\Database\Eloquent\Factories\Factory<\App\Models\Post> */class PostFactory extends Factory{ protected $model = Post::class; /** * Define the model's default state. * * @return array<string, mixed> */ public function definition(): array { return [ 'title' => fake()->sentence(), 'body' => fake()->paragraph(5), ]; }}Next, let's create the seeder file in database/seeders/PostSeeder.php. Update the content of the file with the code below
<?php namespace Database\Seeders; use Illuminate\Database\Seeder;use App\Models\Post; class PostSeeder extends Seeder{ public function run(): void { Post::factory() ->count(10) ->create(); }}Next, we need to register the Postseeder in DatabaseSeeder. Update database/seeders/DatabaseSeeder.php with the code below
<?php namespace Database\Seeders; use App\Models\User;use Illuminate\Database\Console\Seeds\WithoutModelEvents;use Illuminate\Database\Seeder; class DatabaseSeeder extends Seeder{ use WithoutModelEvents; /** * Seed the application's database. */ public function run(): void { // User::factory(10)->create(); $this->call([ PostSeeder::class, ]); }}Then seed the database using the command below
php artisan db:seedYou should now have a posts collection populated with sample documents.
Performance Log
Query logs will be stored in the performance_log collection. We need to create a PerformanceLog model and update the code to save logs to the MongoDB collection. In your project directory, create the model using the command below
php artisan make:model PerformanceLogThen update the content of the file with the code below
<?php namespace App\Models; use MongoDB\Laravel\Eloquent\Model; class PerformanceLog extends Model{ protected $connection = 'mongodb'; protected $collection = 'performance_logs'; protected $fillable = [ 'route', 'collection', 'operation', 'duration_ms', 'request_duration', 'is_slow', 'created_at' ];}Creating the QueryMonitorService
Next, we need to create the service responsible for collecting query metrics. This service will be called later in the middleware file. For now, create app/Services/QueryMonitorService.php and update the code with the code below:
<?php namespace App\Services; use App\Models\PerformanceLog; class QueryMonitorService{ protected array $queries = []; protected int $slowThreshold = 200; // ms public function record(string $collection, string $operation, float $duration): void { $this->queries[] = [ 'collection' => $collection, 'operation' => $operation, 'duration_ms' => $duration, 'is_slow' => $duration > $this->slowThreshold ]; } public function persist(string $route, float $requestDuration): void { foreach ($this->queries as $query) { PerformanceLog::create([ 'route' => $route, 'collection' => $query['collection'], 'operation' => $query['operation'], 'duration_ms' => $query['duration_ms'], 'request_duration' => $requestDuration, 'is_slow' => $query['is_slow'], 'created_at' => now() ]); } }}The QueryMonitorService is responsible for collecting and storing query performance metrics during a request. The record() method captures information about each MongoDB operation, including the collection name, operation type, and execution time. Queries that exceed the defined $slowThreshold are automatically flagged as slow.
At the end of the request, the persist() method saves the collected query data along with the route name and total request duration to the performance_logs collection. This allows us to later analyze which queries were executed and identify potential performance bottlenecks.
Listening to MongoDB Driver Events
MongoDB provides a powerful monitoring feature through its PHP driver. We can subscribe to database commands using a Command Subscriber to retrieve information about the request at runtime. Create the subscriber class in app/Monitoring/MongoCommandSubscriber.php and update it with the code below:
<?php namespace App\Monitoring; use MongoDB\Driver\Monitoring\CommandSubscriber;use MongoDB\Driver\Monitoring\CommandStartedEvent;use MongoDB\Driver\Monitoring\CommandSucceededEvent;use MongoDB\Driver\Monitoring\CommandFailedEvent;use App\Services\QueryMonitorService; class MongoCommandSubscriber implements CommandSubscriber{ protected array $startTimes = []; protected array $operations = []; protected array $collections = []; public function commandStarted(CommandStartedEvent $event): void { $requestId = $event->getRequestId(); $this->startTimes[$requestId] = microtime(true); $operation = $event->getCommandName(); $command = get_object_vars($event->getCommand()); $collection = $command[$operation] ?? 'unknown'; $this->operations[$requestId] = $operation; $this->collections[$requestId] = $collection; } public function commandSucceeded(CommandSucceededEvent $event): void { $requestId = $event->getRequestId(); if (!isset($this->startTimes[$requestId])) { return; } $duration = (microtime(true) - $this->startTimes[$requestId]) * 1000; $operation = $this->operations[$requestId] ?? $event->getCommandName(); $collection = $this->collections[$requestId] ?? 'unknown'; $monitor = app(QueryMonitorService::class); $monitor->record( $collection, $operation, $duration ); unset($this->startTimes[$requestId]); unset($this->operations[$requestId]); unset($this->collections[$requestId]); } public function commandFailed(CommandFailedEvent $event): void { $requestId = $event->getRequestId(); // Clean up tracked state when a MongoDB command fails. unset($this->startTimes[$requestId]); unset($this->operations[$requestId]); unset($this->collections[$requestId]); }}The MongoCommandSubscriber listens to database events emitted by the MongoDB PHP driver. When a MongoDB command starts, the commandStarted() method records the start time and stores details about the operation and collection being queried.
When the command finishes successfully, the commandSucceeded() method calculates the execution duration and forwards the query metrics to the QueryMonitorService. This allows the system to track how long each database operation takes.
If a command fails, the commandFailed() method simply clears any tracked data for that request to keep the monitoring state clean.
Registering the Subscriber
Now we need to register the subscriber created above with the MongoDB driver. To do this, we addSubscriber() in the boot() method of AppServiceProvider.php.
Open app/Providers/AppServiceProvider.php and update the page with the code below
<?php namespace App\Providers; use App\Services\QueryMonitorService;use Illuminate\Support\ServiceProvider;use function MongoDB\Driver\Monitoring\addSubscriber;use App\Monitoring\MongoCommandSubscriber; class AppServiceProvider extends ServiceProvider{ /** * Register any application services. */ public function register(): void { // Share one monitor instance per request lifecycle. $this->app->singleton(QueryMonitorService::class, function () { return new QueryMonitorService(); }); } /** * Bootstrap any application services. */ public function boot(): void { addSubscriber(new MongoCommandSubscriber()); }}Now every MongoDB command executed by the application will be monitored.
Creating Performance Middleware
Next, let's create the middleware to track request duration using the following command
php artisan make:middleware PerformanceMiddlewareNavigate to the newly created middleware file and update the content with the code below
<?php namespace App\Http\Middleware; use Closure;use Illuminate\Http\Request;use Symfony\Component\HttpFoundation\Response;use App\Services\QueryMonitorService; class PerformanceMiddleware{ /** * Handle an incoming request. * * @param \Closure(\Illuminate\Http\Request): (\Symfony\Component\HttpFoundation\Response) $next */ public function handle(Request $request, Closure $next): Response { $start = microtime(true); $response = $next($request); $requestDuration = (microtime(true) - $start) * 1000; $monitor = app(QueryMonitorService::class); $resolvedRoute = $request->route(); $route = $resolvedRoute?->getName() ?? $resolvedRoute?->uri() ?? $request->path(); $monitor->persist($route, $requestDuration); return $response; }}Next, we need to register the middleware. At the time of writing, this is a Laravel 12.x project. Middles are registered inside bootstrap/app.php. If you have a different Laravel version. Check the Laravel documentation on how to register middleware.
With that said, navigate to bootstrap/app.php and update it with the code below.
<?php use Illuminate\Foundation\Application;use Illuminate\Foundation\Configuration\Exceptions;use Illuminate\Foundation\Configuration\Middleware;use App\Http\Middleware\PerformanceMiddleware; return Application::configure(basePath: dirname(__DIR__)) ->withRouting( web: __DIR__.'/../routes/web.php', commands: __DIR__.'/../routes/console.php', health: '/up', ) ->withMiddleware(function (Middleware $middleware): void { $middleware->web(append: [ PerformanceMiddleware::class, ]); }) ->withExceptions(function (Exceptions $exceptions): void { // })->create();Testing Query Monitoring
Let's test what we've built so far. To get started, we need a route. Create a simple web route to trigger database queries. In routes/web.php update the content with the code below
<?php use Illuminate\Support\Facades\Route;use App\Models\Post; Route::get('/', function () { return view('welcome');}); Route::get('/posts', function () { $posts = Post::where('title', 'like', '%API%') ->limit(10) ->get(); return response()->json($posts);});Now, we can start the server with the command below
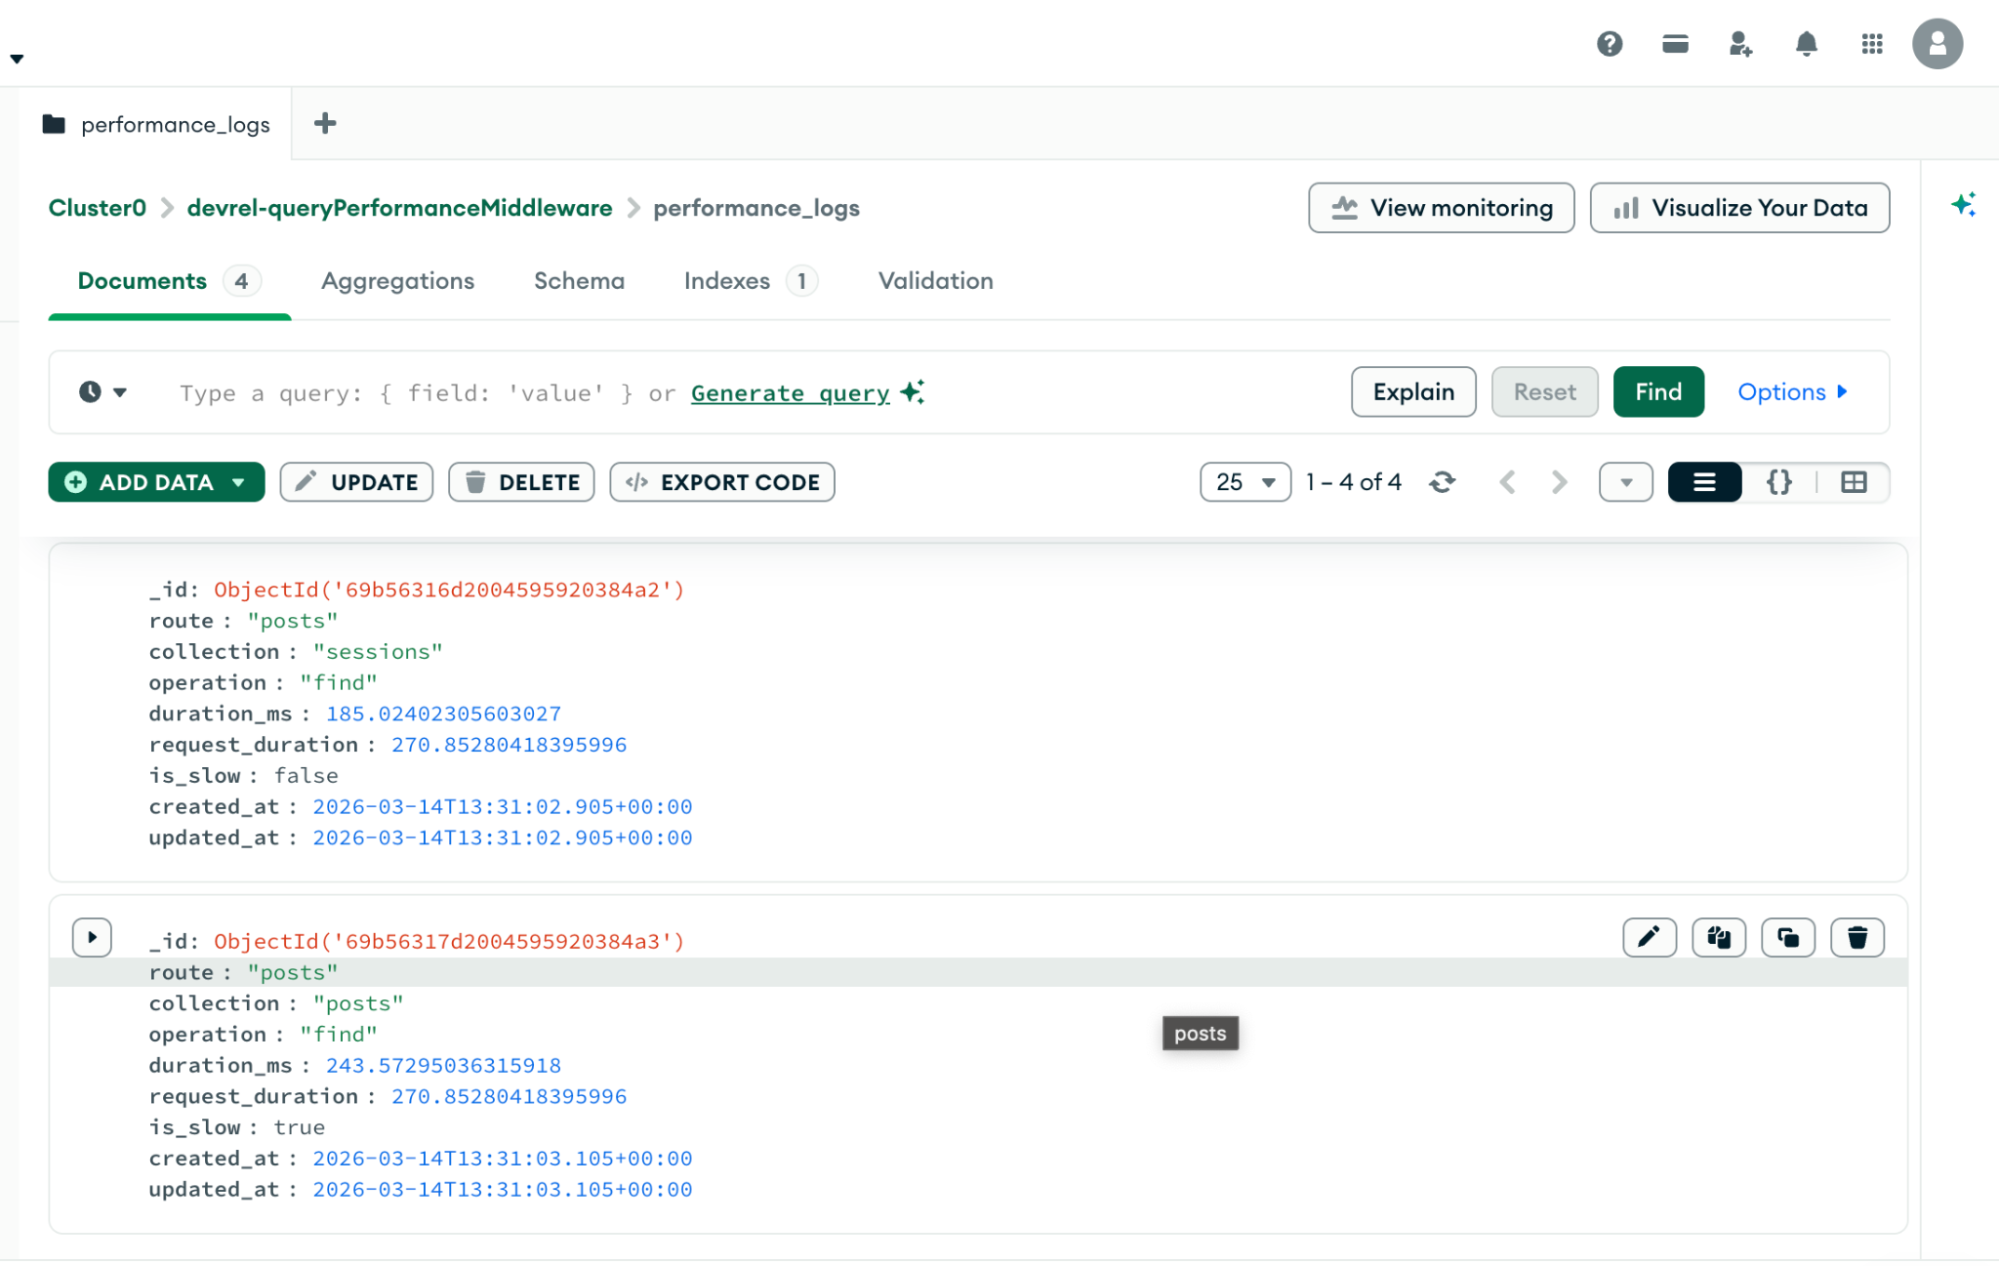
php artisan serveThen visit the /posts route. We expect to get a response like the following from the browser
[ { "title": "Delectus atque odit sapiente ea maxime doloribus consequatur.", "body": "Ut quis alias molestiae. Incidunt aut libero aut. Vel omnis et voluptatum doloremque ipsa. Illum quibusdam in rerum quam sunt voluptas ipsa. Sequi aliquid culpa quas. Ut iure quos corrupti consequatur commodi exercitationem ullam.", "updated_at": "2026-03-11T15:53:31.954000Z", "created_at": "2026-03-11T15:53:31.954000Z", "id": "69b18ffb449c5f787f0d08b9" }]And our MongoDB performance_log collection should contain similar records
Automatically Cleaning Logs with TTL Indexes
Systems like this can generate a large number of log records. If these logs are never removed, the performance_logs collection will continue to grow and eventually consume unnecessary storage.
MongoDB provides a built-in feature called TTL (Time To Live) indexes that automatically delete documents after a specified time. This allows us to keep only recent monitoring data while old logs are removed automatically.
Since we are using MongoDB Atlas, we can create the TTL index directly from the Atlas dashboard following the simple steps below:
- Open your MongoDB Atlas dashboard
- Navigate to your cluster and click Browse Collections
- Select the
performance_logscollection - Open the Indexes tab and click Create Index
Configure the index with the following values:
Field: created_atType: Ascending (1)TTL: 604800 secondsIf you're not using MongoDB Atlas, you can create the TTL index directly from the MongoDB shell using the command below:
db.performance_logs.createIndex( { created_at: 1 }, { expireAfterSeconds: 604800 })This achieves the same result by automatically deleting logs after seven days.
604800 seconds is equal to 7 days. Once the index is created, MongoDB will automatically delete any performance log older than seven days.
Why This Approach Works Well
This architecture keeps monitoring concerns separate from application logic.
The middleware measures request performance while the MongoDB command subscriber captures database-level metrics. Because the subscriber hooks into the driver itself, it automatically detects queries without modifying application code.
The result is a simple but effective monitoring system that can help identify slow queries, diagnose performance bottlenecks, and improve application efficiency.
Conclusion
Database performance issues are often difficult to diagnose without visibility into query execution. By combining Laravel middleware with MongoDB driver monitoring, we can build a lightweight system that tracks both request duration and query performance.
Once you understand how to capture database events at the driver level, it becomes much easier to build tools that detect slow queries, surface performance insights, and improve the reliability of your applications.
You can find the full source code on GitHub.
As a bonus, I built a Laravel package for the implementation in this article. Feel free to install and use it in your already existing Laravel and MongoDB projects.