Laravel Telescope 5.24.0 adds two Artisan commands, telescope:list and telescope:show, for reading recorded entries. You can now find a request, exception, job, or query and inspect its batch without opening the dashboard. The September 8, 2026 release also prevents old dashboard requests from replacing the screen you are viewing.
What's New
Find Recorded Entries from the Terminal
telescope:list reads recent entries from Telescope's storage. Pass an entry type to get a table with the appropriate columns:
php artisan telescope:list requestFor requests, that means the UUID, method, URI, status, duration, and creation time. Telescope has separate table layouts for queries, exceptions, jobs, cache operations, logs, mail, commands, and outgoing HTTP requests. Omit the type to see a mixed list with a short summary for each entry.
Filters narrow the list by tag, batch ID, or family hash:
php artisan telescope:list exception --limit=5php artisan telescope:list request --tag=Auth:42php artisan telescope:list --batch=79a09461php artisan telescope:list --family=8e872e9a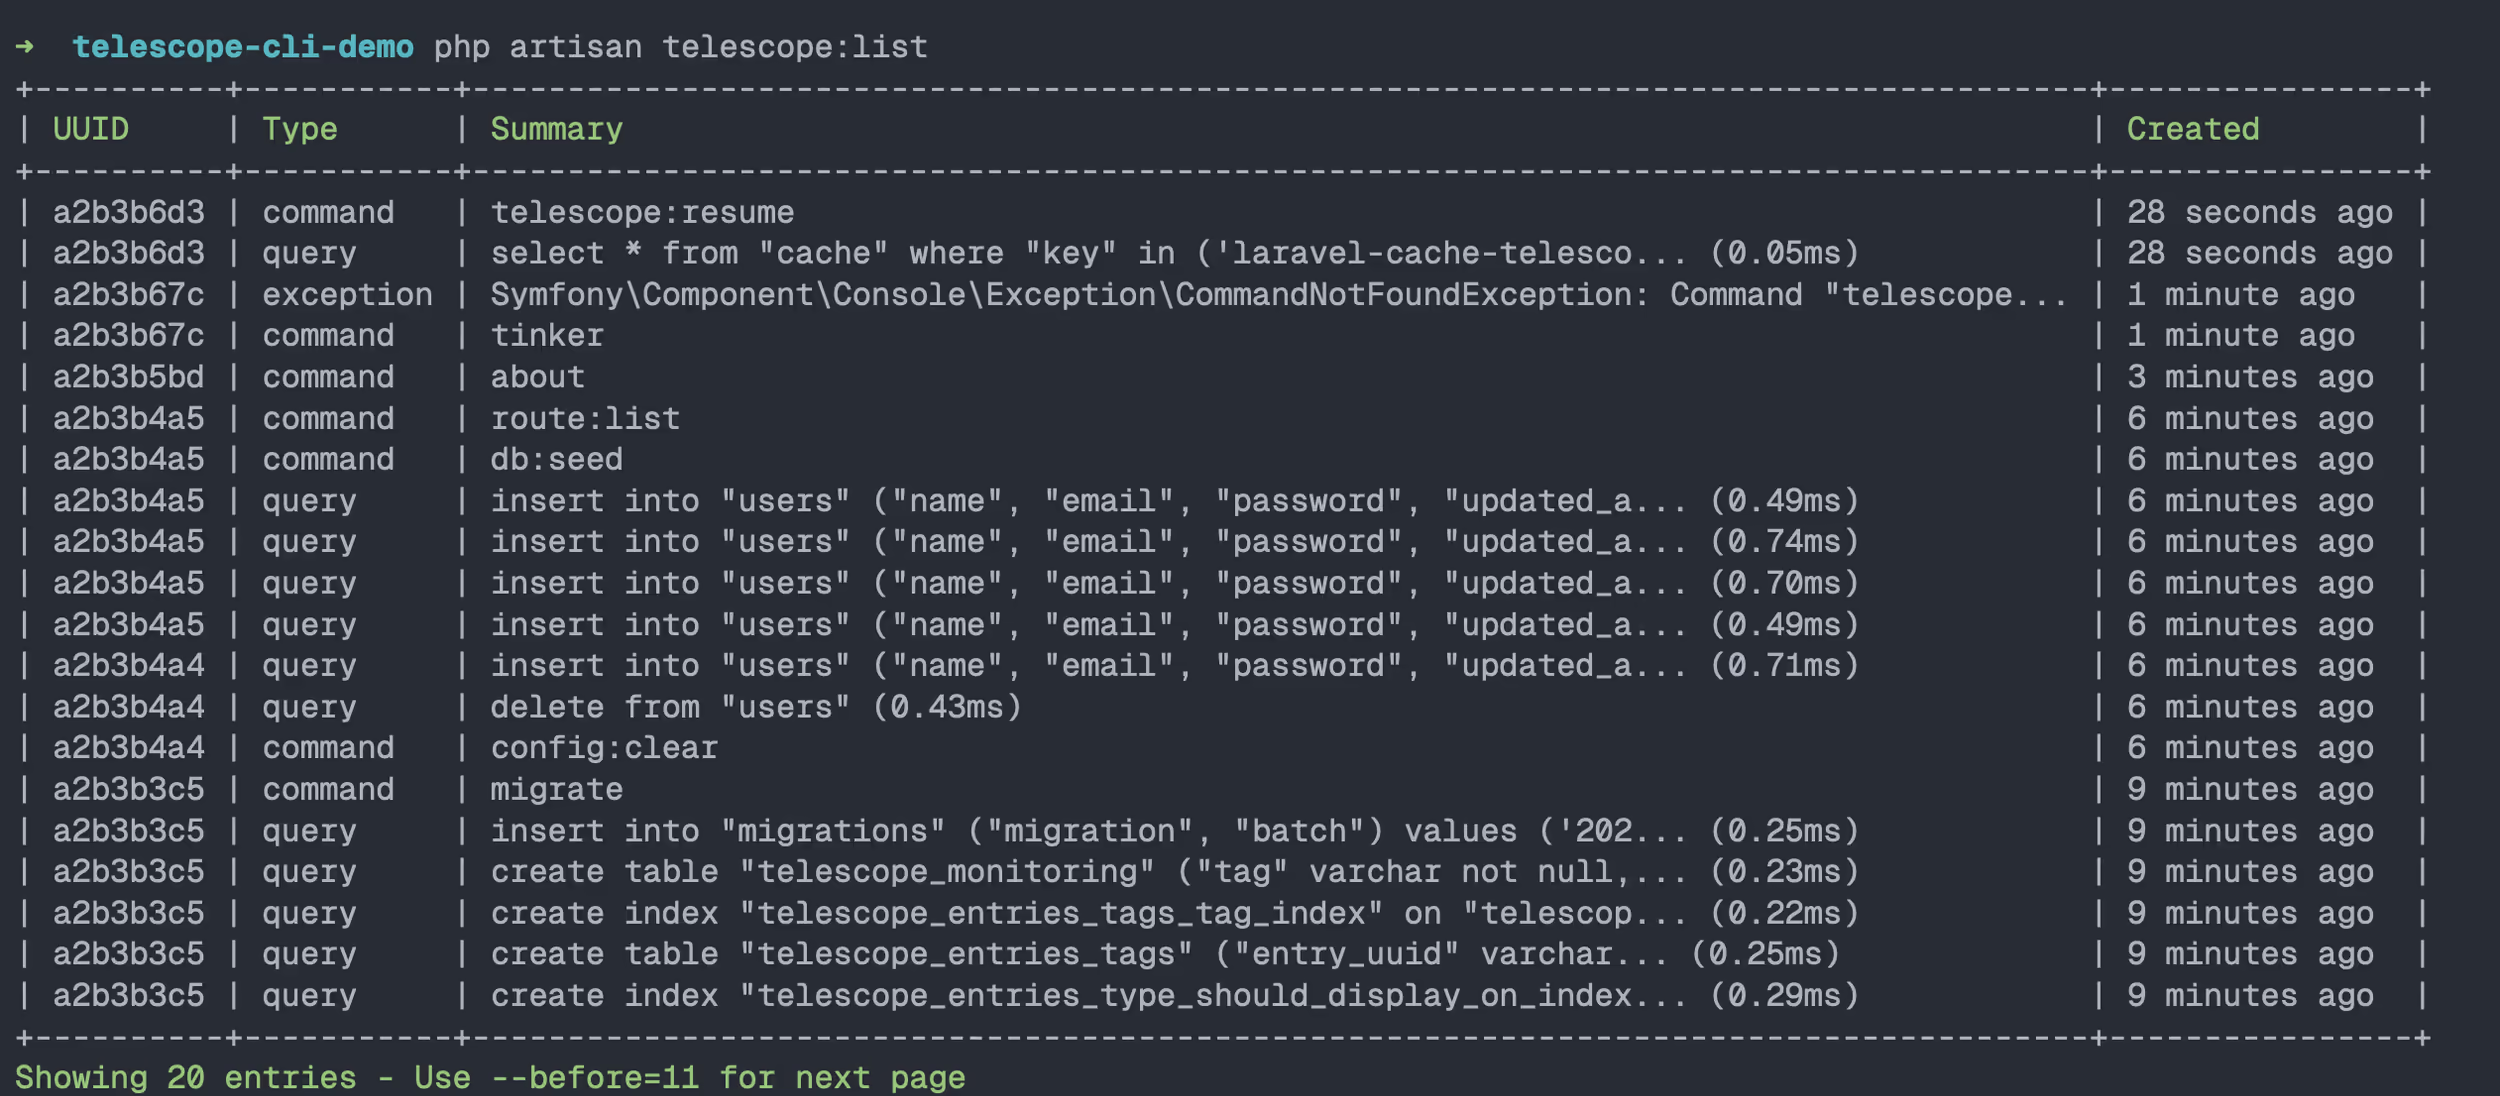
Each page contains 20 entries by default. A full page ends with a --before cursor for fetching the next set:
php artisan telescope:list request --before=24817The cursor is the sequence ID of the final entry on the current page. If you pass an invalid entry type, Telescope prints the supported values.
Inspect an Entry and Its Batch
Copy an entry UUID into telescope:show to see its details and the rest of its batch:
php artisan telescope:show 9d90e4f0-1a15-4f6a-9cca-2e95d70d8d9f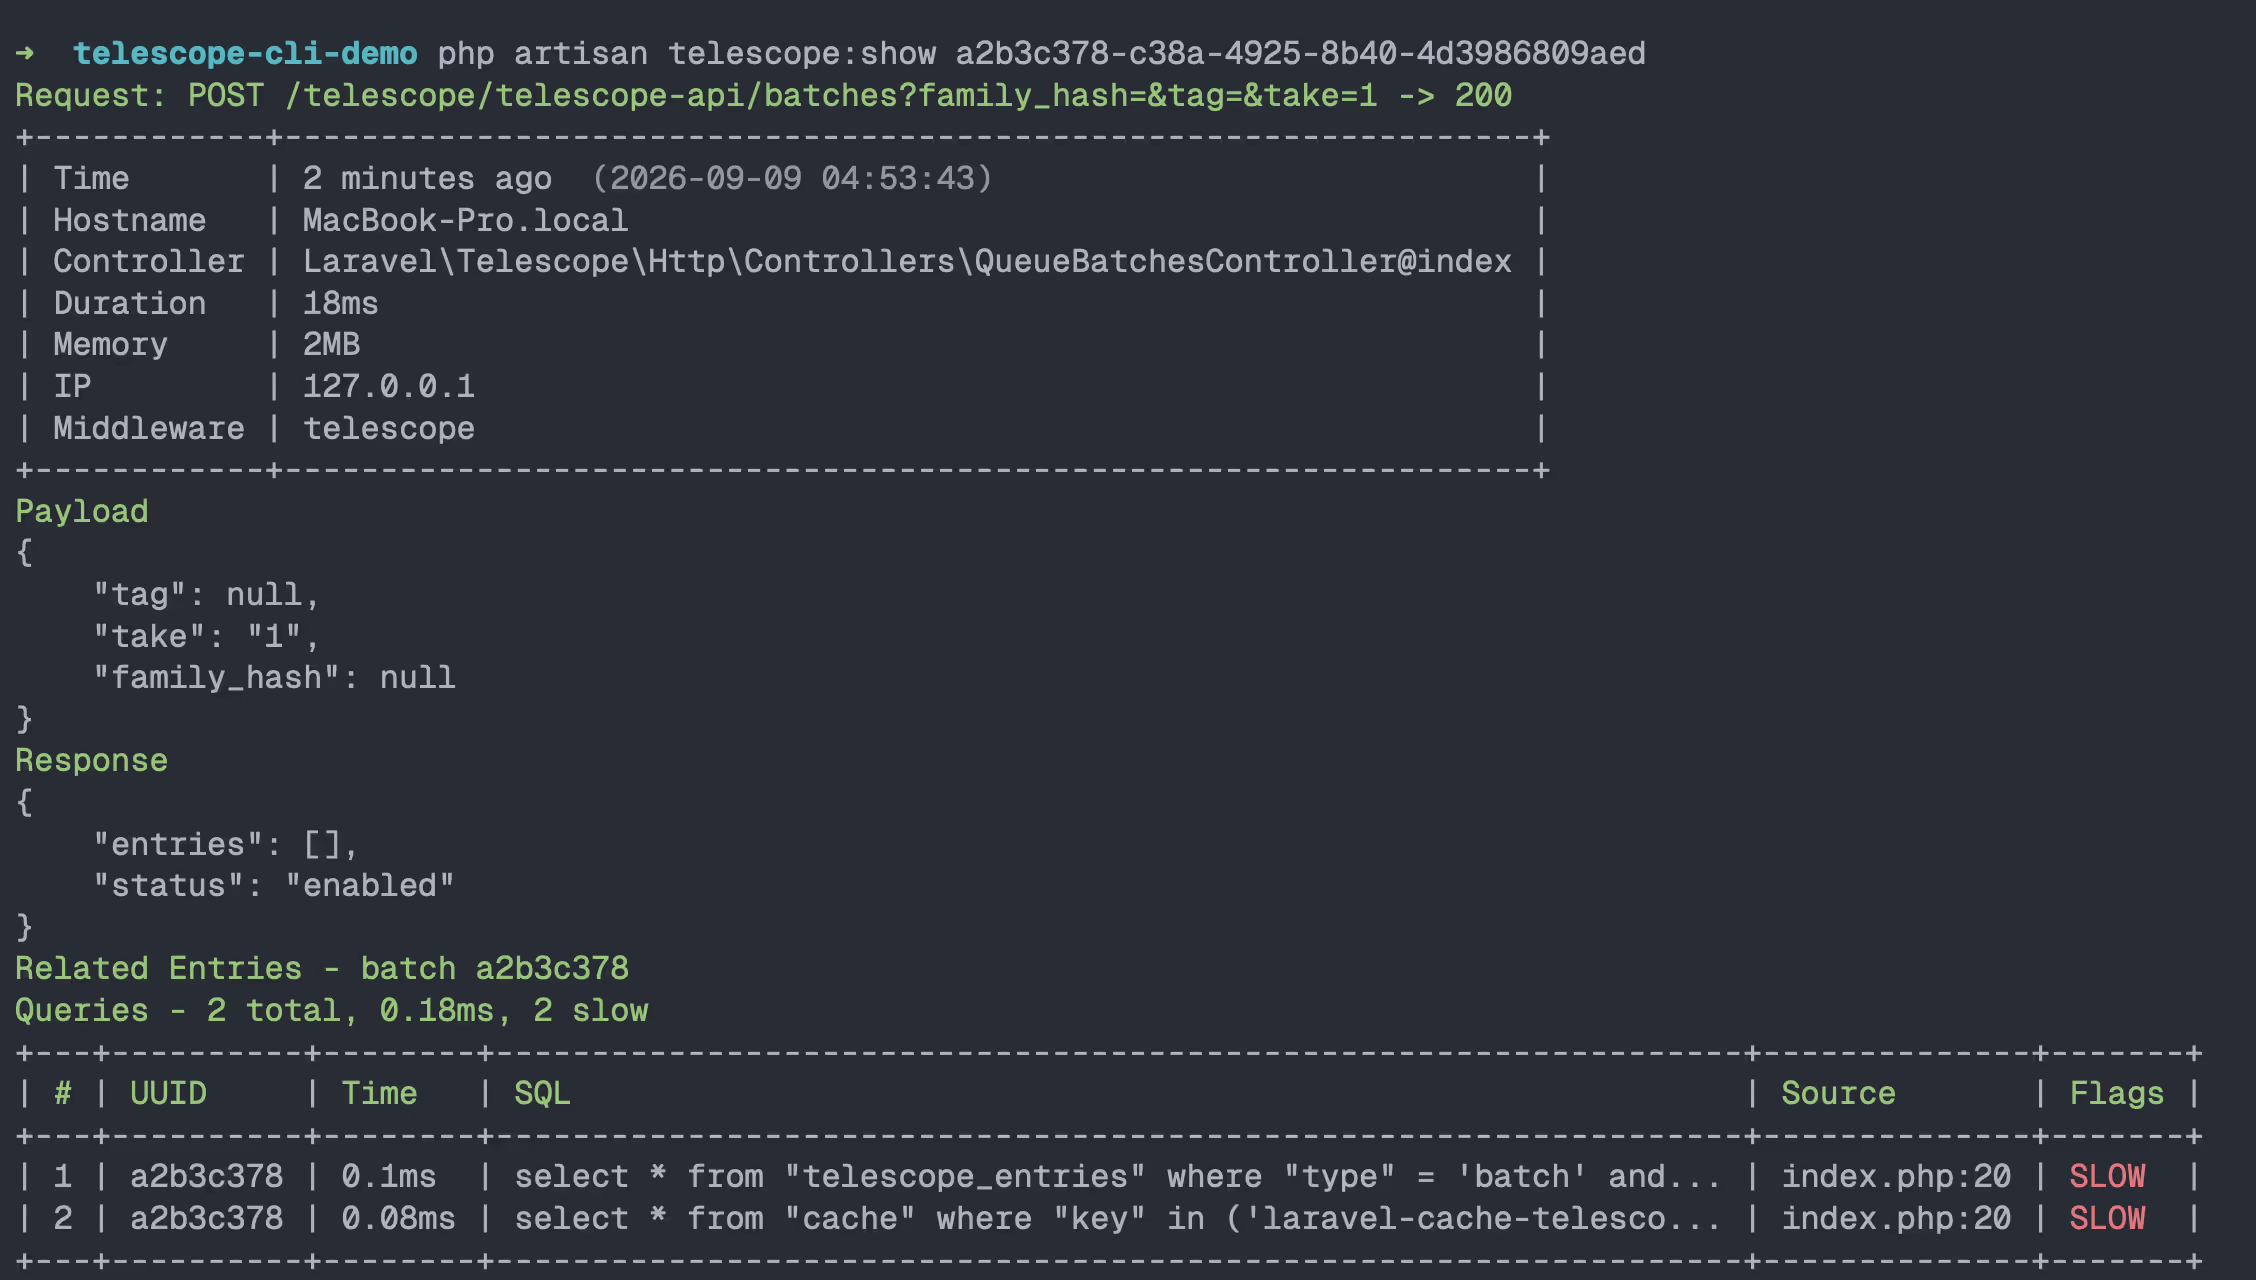
Telescope assigns a batch ID to the work produced by a request, job, or command. A request batch can contain queries, cache operations, logs, events, exceptions, and rendered views.
Requests, exceptions, and jobs have dedicated detail views. An exception includes its class, message, location, nearby source code, and stack trace. A failed job shows its queue details and exception. Other types use fields from their stored content.
In the batch table, SLOW marks queries above Telescope's configured threshold. DUP marks queries that share an SQL pattern, a useful starting point when checking for N+1 query problems. The cache section reports hits, misses, and a hit rate when the batch contains lookups.
For the most recent entry, replace the UUID with latest or latest:{type}:
php artisan telescope:show latestphp artisan telescope:show latest:requestphp artisan telescope:show latest:exceptionA coding agent can make a request, run telescope:show latest:request, and read its queries without copying an identifier from a separate command.
Use a comma-separated --type list to trim a large batch:
php artisan telescope:show latest:request --type=query,cache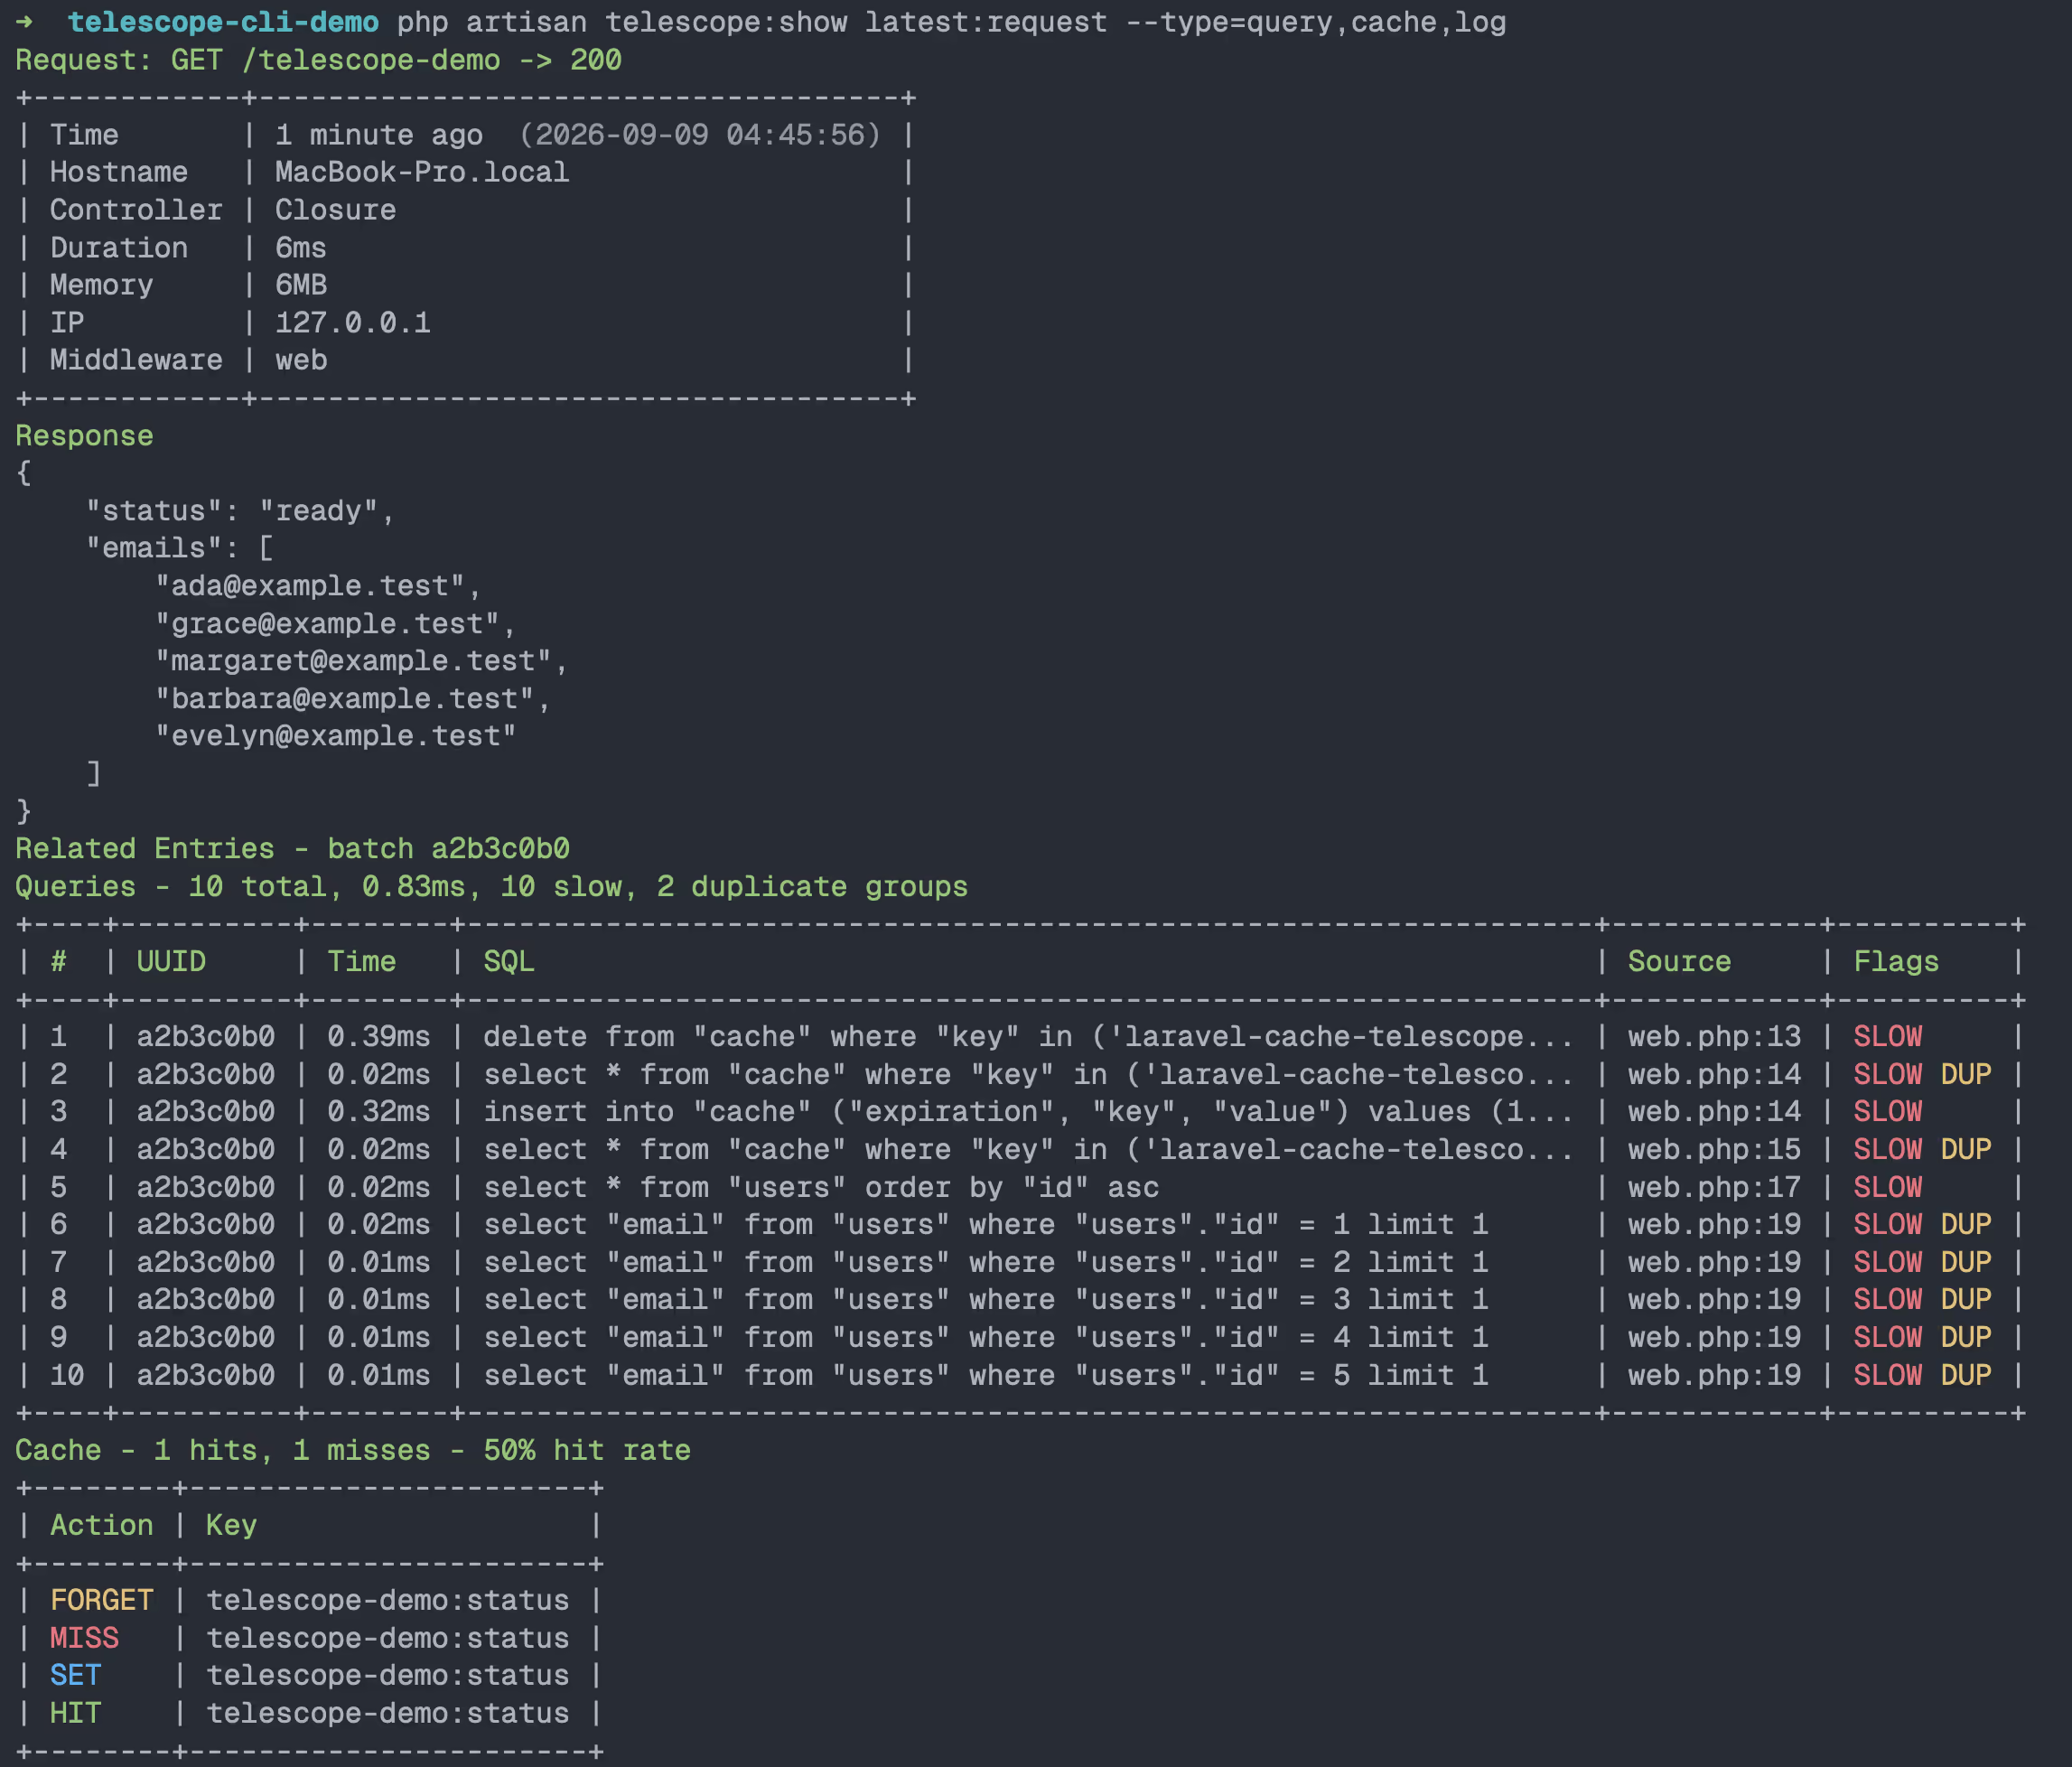
Table output truncates long SQL statements, messages, and payloads. Add --full to print them in full.
Use JSON for Scripts and Coding Agents
Both commands accept --json. telescope:list --json returns an array of entries, or an empty array when no entries match. telescope:show --json returns an entry object and a chronological batch array. Its --type filter runs before the batch is returned.
For example, jq can extract the location of the latest exception:
php artisan telescope:show latest:exception --json \ | jq '.entry.content | {class, message, file, line}'It can also select recent server errors from recorded requests:
php artisan telescope:list request --json --limit=50 \ | jq '.[] | select(.content.response_status >= 500) | {id, uri: .content.uri, status: .content.response_status}'Use JSON when another program will consume the result or when you need exact, untruncated values. Use the tables while working interactively.
The release includes a Telescope debugging skill for Laravel Boost. Coding agents following it use these commands to investigate slow requests, exceptions, failed jobs, repeated queries, and cache misses. They must finish with a specific query or a file and line, rather than a symptom.
Contributor @pushpak1300 added the commands in #1763.
Cancel Stale Dashboard Requests During Navigation
Telescope polls for new entries while its dashboard is open. Previously, a request started on one screen could finish after you selected a tag, opened an entry, or went back. Its response could replace the current results with entries from the old screen or filter.
The index, preview, dump, and monitoring screens now use an AbortController. Telescope aborts their active requests when the component is destroyed or the route query changes, and clears the polling timers before starting them for the new screen.
A server error stops polling and displays its response status. Requests cancelled during navigation do not show an error.
Contributor @pushpak1300 made this change in #1764.
References
- Laravel Telescope 5.24.0 release
- Compare v5.23.0...v5.24.0
- PR: #1763 (Telescope CLI commands)
- PR: #1764 (cancel in-flight dashboard requests)