A monolithic architecture is one of the oldest architectures used for making software and applications for various companies. In layman's terms, Monolith means everything in a single box. Monolithic software is supposed to be self-contained, and its components are interrelated and interdependent.
When it comes to monoliths, updating a single component or rolling out a new feature is difficult. Suppose any program component needs an update. In that case, someone would need to rewrite the entire application, whereas, in a microservice, one can alter any individual module without affecting other sections of the program.
Monitoring monolithic architecture is also challenging as you cannot see each part of the architecture separately. You will have to be extra smart and experienced to directly predict the bug and solve it.
This article will discuss how we can monitor monolithic architecture successfully. In addition, we'll talk about how to move from predicting bugs to debugging your app.
Why Scout APM is an Industry Leader in Monolithic Application Performance Monitoring
Monolithic architecture is difficult to track and monitor, but there are some benefits to utilizing this method. One of the most important benefits is they are easily implementable and require less planning. Using monolithic monitoring, we can make a quick release, and it will reflect in the application. Here are some other key benefits of monolithic architecture:
- Less latency - Users in a monolith experience less latency (time for data to be processed) than they would in a microservices-based system since all calls are local.
- Quick Releases - Since most aspects are small and not expanded, rolling out a new release requires less effort than the microservices system.
- Ease in exchange of data : In monolithic applications, most components are in one place, so exchanging data within the different components is easy compared to microservices, where every part may have a separate environment.
- Less time in planning : In monolithic monitoring, you do not have to plan so much about making the application. You do not worry about integrating multiple services and making them work together. Hence you can execute things faster and release the application for end-users.
Scout APM has many features which help in managing your monolith architecture-based application. So let us get to know about the benefits Scout provides us:
Reason 1: Directly point the endpoints creating problem
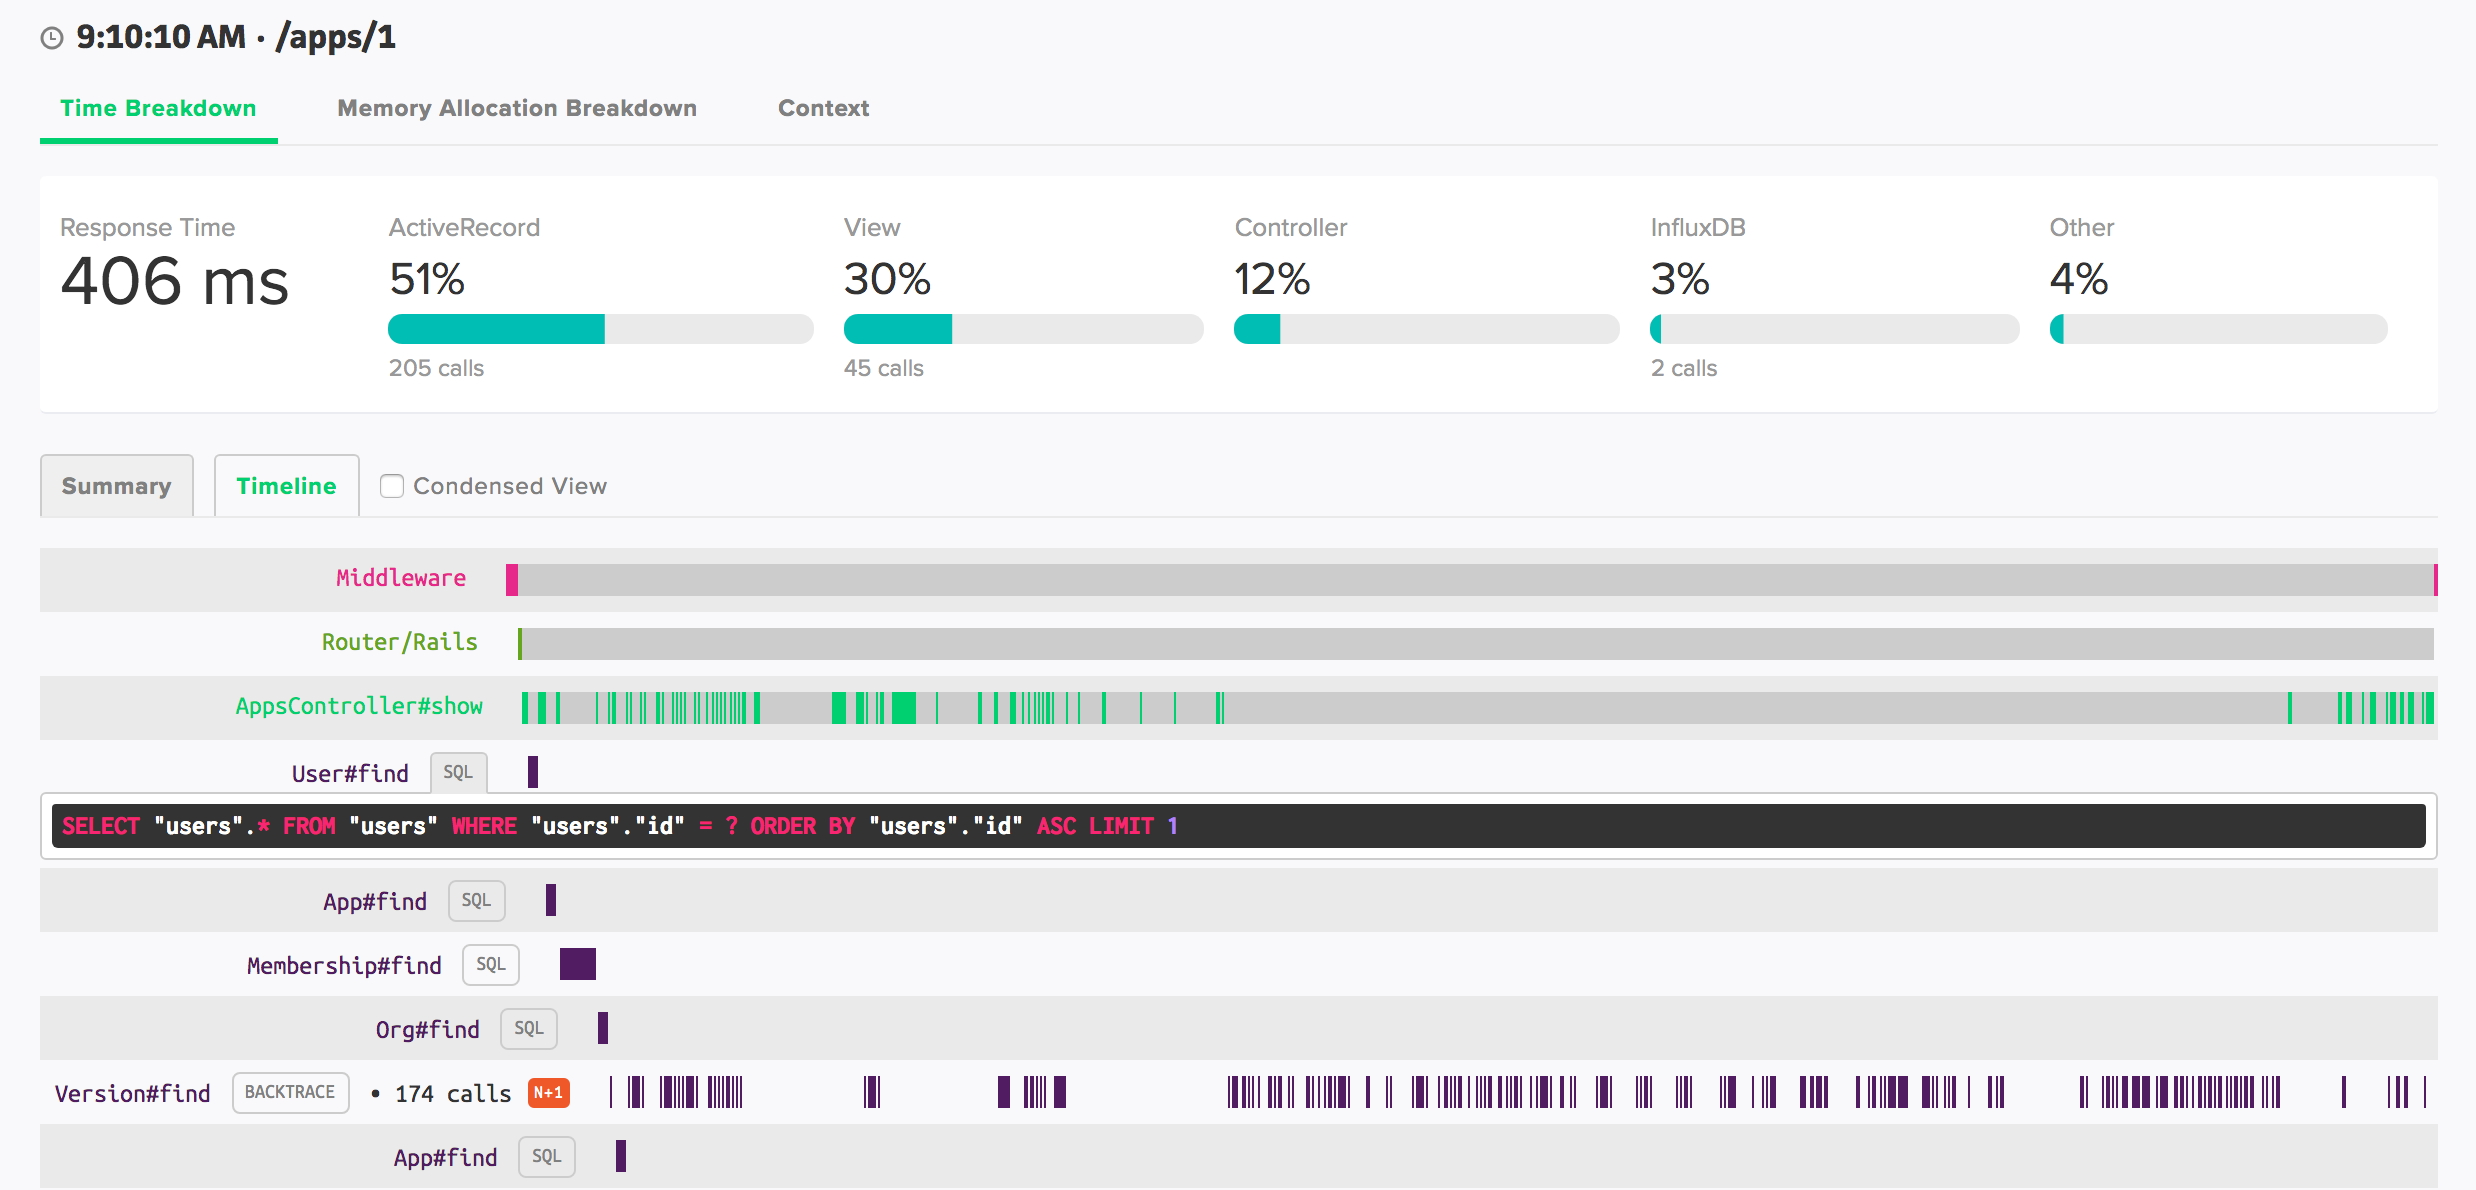
Scout APM has the feature of directly telling which endpoints on your monolithic application create problems while fetching or posting data. You can simply use the drag and stretch for selecting the area in which your application has performed abnormally, and Scout will show the full details of that area selected. After that, you see each endpoint's average response time and see the slow endpoints. You can also see the last developer to change that specific line of code, which gives you the idea of which developer you need to contact. You can see how you can backtrace the code on Scout using their GitHub integration in the figure below.
Reason 2: Splitting your monoliths into simpler parts
As already said, monoliths can are big machines that consist of several internal machines inside them, but you cannot see those machines transparently. Hence it is important to divide your monoliths applications into simpler applications or modules.
This step is so important because it is much easier to monitor a big chunk when it's broken down into several smaller pieces. Each module must specify one or more interface functions by which the flow will travel. Maybe it's time to refactor the code if you're missing a clear interface method.
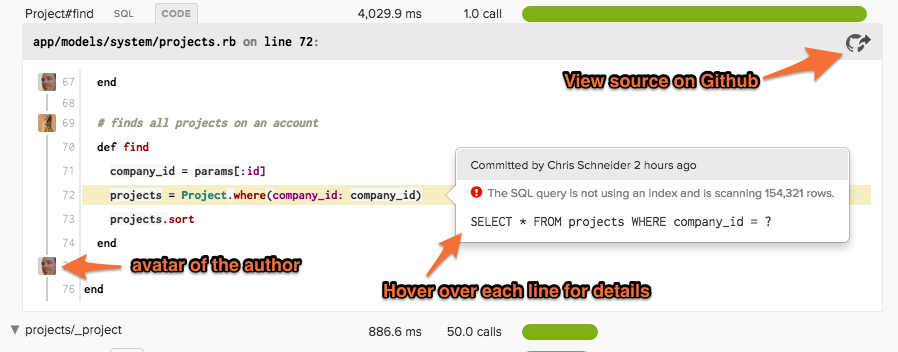
Scout automatically captures detailed transactions from your web endpoints and background jobs. The transaction traces provide a number of visual queues that can find hotspots. From this view (given below in figure), you may investigate bottlenecks down to the line of code, author, commit date, and deployment time.
Method calls that take more than 500 milliseconds will have "CODE" buttons next to them. You can see the line-of-code, corresponding SQL or HTTP endpoint (if applicable), author, commit date, and deploy time for the relevant sluggish code.
Reason 3: Memory Bloat management
Memory bloat is when some code uses too much memory because that code is no longer needed but still consumes space and logs the memory. There is a fine difference between memory leak and memory bloat. Memory bloat happens when the consumption of memory increases in a short time, but memory leak is a process in which memory consumption increases slowly.
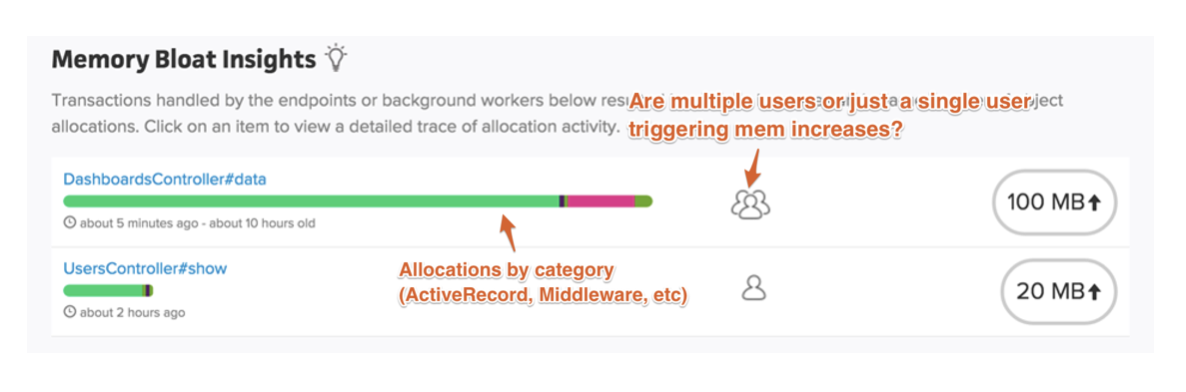
Scout APM protects your application from memory bloat. Scout isolates the controller-actions that are responsible for the highest percentage of allocations. Viewing transaction traces of memory-hungry requests allows you to pinpoint hotspots in code.
On the dashboard, you can see a breakdown of object allocation per tier (ActiveRecord, ActionView, and so on).
Reason 4: Real-time error monitoring
Scout APM's error monitoring simplifies your task and saves your time, money, and energy every time. It increases developer productivity, decreases developer fatigue, and reduces your company's debugging costs. Use Scout's error monitoring to supplement your application monitoring so you can spend less time troubleshooting and more time developing excellent products.
Within one solution, connect your application monitoring data with error monitoring. Scout APM allows you to see all monitoring information in one location, eliminating the need to transfer between performance monitoring and problem reporting applications.
Additionally, the Github integration allows you to create errorless processes and spot mistakes faster. Scout's monitoring tool integrates with your Github repositories, allowing your team to quickly resolve issues.
Scout APM has affordable bundle pricing, so you don't have to pay for things you don't need, and it allows you to focus on what you enjoy rather than worrying about enterprise-level expenditures.
Reason 4: Use of cutting edge technologies
Companies are trying to optimize their applications as much as possible. Optimized applications give the customers the best experience and increase the company's profit. In order to optimize, we have to use new technologies designed to deal with the pain points of an application. Scout APM provides monitoring support for most of these technologies, so you can better concentrate on building them, not monitoring them. Scout APM currently supports Ruby, Python, NodeJS, PHP, and Elixir. Installation of these agents is simple; you just have to follow the simple steps in this doc.
H2: Essential Monolithic Monitoring Metrics
Teams must observe metrics carefully to know their application's health. This section will cover the metrics that you should consider while monitoring your monolith application.
1. Apdex Score
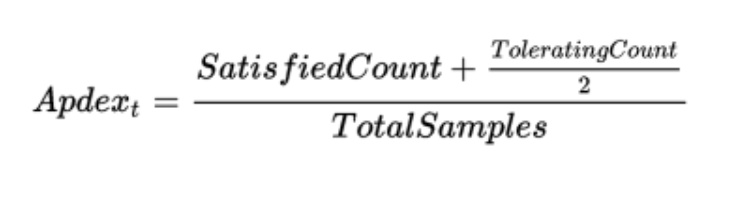
Apdex score is one of the industry's most important metrics. It shows how many customers are satisfied with your services. It shows how fast our application responds to web requests.
These requests are categorized as satisfied (quick), tolerating (slow), too slow, and unsuccessful. After that, a basic formula is used to get a score ranging from 0 to 1.
Scout APM continuously tracks the Apdex or satisfaction scores of each of your applications and shows them right on your dashboard for quick and easy access.
2. Error Rates
Error rates are the frequency of errors that your application is facing. It is a very critical metric because errors directly interact with users.
There are three possible methods for tracking application errors:
- HTTP Error Percentage - The percentage of web requests that failed.
- Exceptions logged – The number of unhandled and logged faults in your program.
- Exceptions Thrown — The total number of exceptions thrown.
Thousands of exceptions are frequently thrown and ignored within a program. Hidden application exceptions can wreak havoc on your system's performance.
3. Number of Application Instances
You may have noticed that the more application instances your smartphone has the more vulnerable to be hanged. The same case happens with your server too. The larger number of application instances it runs, the slower it becomes. It's important to know how many server/application instances run if your program scales up and down in the cloud. Auto-scaling ensures that your application scales to match demand while also saving you money during off-peak periods. This presents some unique monitoring issues as well. The number of application instances also helps us to know the maximum number of applications at a single time the server can handle. In this way, you can set up more servers if needed from a different location to make your application smooth.
4. Request Rate
Request Rate, as the name suggests, is the number of requests your application is getting per time segment. The success of your application will be influenced by knowing how much traffic it receives. Increases or decreases in traffic may have an impact on all other application performance indicators. Request rates help us to understand the dynamics of how your application scales by comparing them to other application performance data.
It's also a good idea to keep an eye on the request rate to look for spikes or even idleness. If you have a busy API that suddenly receives no traffic, this could be a serious problem. It also helps predict the time of day your customers are most active. Using this, you can plan the new releases or application periodic maintenance time.
The number of concurrent users is a similar but slightly distinct metric to keep an eye on to see how it relates to the others.
5. Application Availability
Application availability is the measure of uptime of the server through a time period. Your uptime is important if your website accepts huge amounts of traffic because even 1-hour of downtime can take you into thousands of dollars of loss. Monitoring and measuring whether or not your application is online and available is an important measure to track.
Business owners take downtime as a serious metric because they do not want their applications to be inactive even for a second. Most of the application performance monitoring tools show the uptime of their application on their website, which is used as an advertisement to show users that they can trust this tool. You can see the Scout APM's status here.
6. Garbage Collection
Garbage collection is very important when we talk about a large-scale application. If you are a developer you're probably aware of the performance issues that trash collection might cause, whether your application is in.NET, C#, or another programming language that uses it.
Garbage collection can significantly cause your process to pause and consume a significant amount of CPU, therefore lowering your revenue from the app. Garbage collection metrics might not be the first thing that comes to mind when considering essential application performance indicators. It could be a hidden performance issue that you should always track.
JDK, a Java development kit, provides a garbage collection class that automatically removes the unused variable when it's unreachable or causing a health issue.
7. CPU Usage
CPU Usage determines the percentage of CPU benign used at a given time. If your CPU usage is high, like 90%, then there is a chance it will create a problem someday. You should not let your application use that much of your CPU as there are some other vital processes of application that require CPU. Monitoring your server's and applications' CPU utilization is fundamental and crucial.
Almost all server and application monitoring software can monitor your CPU utilization and send you alerts. CPU usage helps to determine how much CPU is used for how many requests. By seeing this metric, you can predict if you need to scale the CPUs for your application or not.
Ways of monitoring your monolith as a microservice
There are two methods to monitor your monolithic service as a microservice. Following are the two ways:
Resource Usage Monitoring
You can use a monitoring agent to implement Resource Monitoring, which will collect data from the OS and processes. The measurements should follow the metrics given in the USE method, which contains the following metrics to be collected:
- Usage – the number of resources used by a process, such as the amount of memory it consumes.
- Saturation – the amount of excess work a resource has to handle, which is often queued.
- Errors - the total amount of resource errors.
- Saturation - Measures the number of requests waiting to be processed, also used to calculate the function load. High saturation indicates that the function is under a lot of stress. It's worth noting that high CPU utilization isn't always a sign of a heavy load.
Application Metrics Monitoring
- Dividing your monolithic system into modules is a good idea. Using this method, you can assign each person a single module responsibly. In this way, there will be no confusion in who is managing what.
- Select the critical business and user flows. Concentrate on the most crucial ones. Break down each significant flow into a series of calls, traveling via modules and interfacing routines.
- Determine which "Interface functions" will be used to expose metrics.
- When you break your monolithic application into simpler modules, you can take charge of different functions separately. Then you can attach a separate webhook to the functions and read the response or request passing through that function.
- It's time to start reporting metrics after integrating the metric reporting library (also known as the instrumentation library). For the specified functions, the RED method convention will be a suitable place to start. The saturation and APDEX score can be applied later.
How APM Solutions Save Businesses Time and Money
In some way or another, practically every firm is a software business. Having a 24x7 APM for monitoring your businesses' application can be very fruitful for you, and it solves most problems related to the data. There are many cases where an application performance management tool saves you time and money. Let's discuss a few of them:
Decreasing Downtime of an Application
Downtime is the total time for which your application is not responding to end-users. It may happen due to a server breakdown or mistakenly releasing broken code, and it can cost you a lot of time and money.
For example, In August 2016, Delta Airlines experienced a 5-hour outage. They had to cancel roughly 2,000 flights due to technical issues, and it cost them $150 million. Last year, British Airways and Southwest both experienced major outages that cost them a lot of money [source].
Similarly, Amazon says that if they face a 100ms downtime, it would cost them nearly 1% of sales that day [source]. APM tools tell the development of many errors even if they are seen by the end-users. In this way, you can fix the errors before it reaches your customers.
Preventing Application Problems
Application problems include slow API response and any corner cases where code is not working as expected. If we did not use any application monitoring tools, it would be very difficult for developers to find the reason for the issue and solve it. But these things become very easy when you use application performance monitoring tools.
The earlier a problem is recognized and fixed in the development lifecycle, the less time and money it takes to fix it. In an ideal world, we'd all be able to detect every application flaw as developers develop code or QA work on it.
Scout APM prevents your application from running into problems before actual users face the problem. You can use Scout for free for 14-days and after that just for $161 per month.
Understandably, defects discovered when creating code or in QA are much easier to solve than bugs discovered in production. A small production bug can result in many client support issues. Scout APM also helps identify the issue using logs and other data, helping to solve bugs quickly.
Superb Performance
You may have seen many online tools boast about their uptime or almost zero downtime as it is a feature of the application. But why do they do so? Because customers always like fast applications and loading time significantly contributes to Google's ranking algorithm.
Keep in mind that your application's performance is also a feature. Users appreciate quick software, and it improves the overall perception of your goods. While it may be difficult to measure, it aids consumer conversion and retention. The load time of any website depends on many factors like server response, caching system, and tech stack used. Monitoring these factors is critical to improve site performance and increase traffic to your application.
You can improve server response time by decreasing the load on one server or clearing the cache. You can also make your application using the best possible tech stack which is lightweight, user-friendly, and cost-effective. Even a 1 second extra load time can decrease your website and make your customer go for other options.
Developer Productivity
Experienced developers can be hard to find but hiring them is also costly. In today's economy, they're a scarce resource. It's critical to keep them focused on developing new goods that will help your company expand. Developer tools that increase productivity are extremely valuable. Solving production issues can be time-consuming and difficult.
Monitoring the application gives many clues about how the application is performing in front of end-users. Tracing helps to see the path taken by the user, which resulted in an error. This helps developers easily find the bug. If this thing does not exist, developers have to spend time finding the issue itself, and then they can work on a solution. APM technologies are like a boon for developers productivity as it cuts the time for solving the issue. The more time a developer is doing productive things, the more profitable a company can become.
Knowing the exact person to reach out to
Scout APM lets you know the exact developer to contact regarding an issue. It shows the commit, date, and information needed to solve this issue. The ability to determine who needs to be notified about an issue is undoubtedly APM's most cost-effective feature. Most IT organizations spend a significant amount of time figuring out which infrastructure component is causing an issue, and APM is crucial to speeding up that process. That is an area where there can be significant time savings as well as cost savings in terms of resolving a potential impacting issue.
Keep customers happy
If some of the most used features aren't functioning properly, it may cost you, customers. Scout APM gives you a 100% guarantee that it will monitor the application 24x7 with a minimum chance of leaving a bug unnoticed. This way you will know about most bugs before users actually notice and fix them beforehand.
Time is money in today's world. In some scenarios, such as e-commerce and search, poor performance causes customers to quit transactions and go elsewhere. Reduced productivity as a result of poor performance raises costs because more resources are required to attain the desired results. Scout APM is the software you need to increase and improve your performance.
Always-On Monitoring: A Developer's Best Friend
The most interesting thing about APM solutions is that they are available 24x7 for monitoring your applications.Scout APM monitors your application all the time and notifies you whenever an error or feature failure occurs. You will also get notified when memory leaks, memory bloat, and slow queries occur. It shows each of the data in an interactive UI using tables and charts.
When we talk about monolithic applications, it is very important to break them into simpler services to make monitoring easy. Scout APM gives metrics about smaller services and full tracing whenever any bug occurs. It is critical to keep an eye on everything. Monitoring can be utilized in a variety of disciplines to get the most out of the item under observation. Try Scout APM free for 14-days!