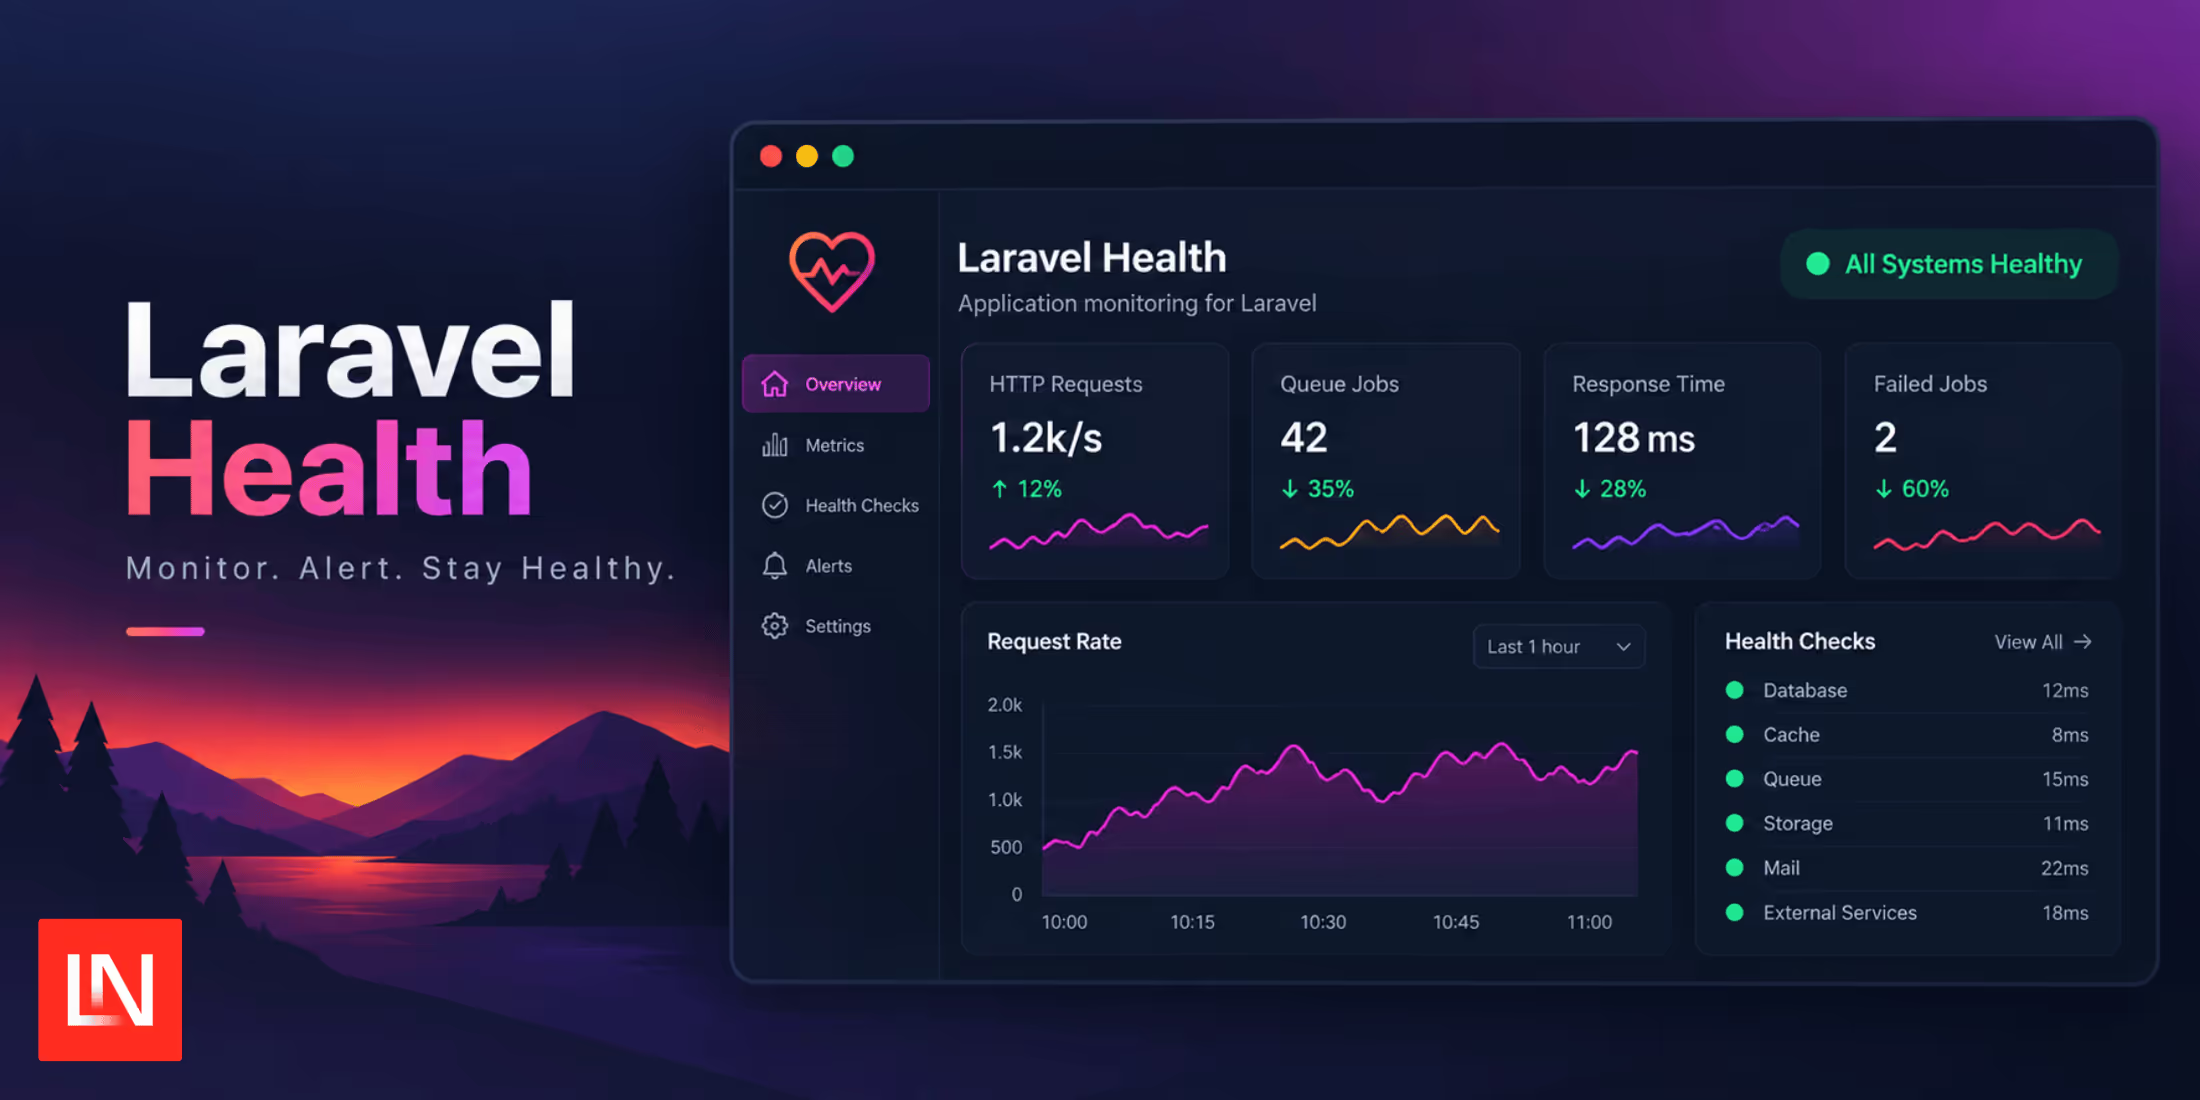
Health for Laravel is a health check package from Sylvester Damgaard. It registers separate endpoints for the three Kubernetes probe types, and a /health/metrics endpoint that Prometheus can scrape. New Laravel applications include the /up health route, which reports whether the application booted. With this package, you assign a different set of checks to each probe.
Here is what the package gives you:
- Kubernetes probes:
/health,/health/ready, and/health/startup, each with its own list of checks - 10 built-in checks: database, cache, queue, storage, Redis, environment, schedule, CPU, memory, and disk space
- Prometheus metrics: check status and duration, plus load, memory, disk, and network gauges
- Container awareness: reads cgroup v1 and v2 limits, so memory numbers come from the container and not the host
- JSON metrics: the same system data at
/health/metrics/json, with the hostname or pod name that served the request health:check: runs the checks from the terminal and exits non-zero on a failure- Response caching: check results are cached for 10 seconds by default
- HTML dashboard: a status page at
/health/ui, disabled by default
Separate Checks for Each Kubernetes Probe
You assign checks to probes in config/health.php:
use Cbox\LaravelHealth\Checks\{ CacheCheck, DatabaseCheck, EnvironmentCheck, QueueCheck, RedisCheck, StorageCheck}; 'checks' => [ 'liveness' => [ DatabaseCheck::class, ], 'readiness' => [ DatabaseCheck::class, CacheCheck::class, RedisCheck::class, QueueCheck::class, StorageCheck::class, ], 'startup' => [ EnvironmentCheck::class, ],],Kubernetes restarts a container when its liveness probe fails. When the readiness probe fails, Kubernetes stops routing traffic to the pod and leaves it running. A probe endpoint returns 200 when every check is ok or warning, and 503 when any check is critical or unknown. The deployment manifest points each probe at its path:
livenessProbe: httpGet: path: /health port: 80 periodSeconds: 15readinessProbe: httpGet: path: /health/ready port: 80 periodSeconds: 10startupProbe: httpGet: path: /health/startup port: 80 failureThreshold: 30 periodSeconds: 5The /health/status endpoint returns every check result along with the hostname, which in Kubernetes is the pod name. The three probe endpoints leave the hostname out.
Prometheus Metrics
The /health/metrics endpoint returns two gauges per health check. app_health_check_status is 1.0 for ok, 0.5 for a warning, and 0.0 for critical or unknown. app_health_check_duration_seconds records how long the check took. The app prefix comes from HEALTH_PROMETHEUS_NAMESPACE.
System metrics come from the author's cboxdk/system-metrics package, which works on Linux and macOS. You get load averages, memory, disk usage per mount point, network bytes per interface, and uptime. Inside a container, the endpoint adds five more metrics:
| Metric | Type |
|---|---|
app_container_memory_limit_bytes |
gauge |
app_container_memory_usage_bytes |
gauge |
app_container_cpu_quota |
gauge |
app_container_cpu_throttled_total |
counter |
app_container_oom_kills_total |
counter |
You can learn more about all the capabilities provided in the Prometheus Metrics documentation.
Checking That the Scheduler Runs
ScheduleCheck reads a heartbeat timestamp from the cache. Schedule the health:heartbeat command in routes/console.php to write it:
use Illuminate\Support\Facades\Schedule; Schedule::command('health:heartbeat')->everyMinute();The check returns critical when the heartbeat is older than max_age_minutes, which defaults to 5. It returns warning when no heartbeat exists yet. Add the check to the readiness list, and the endpoint returns 503 when the task scheduler has not run for five minutes.
Writing a Custom Check
A check implements the HealthCheck contract, which has a name() method and a run() method that returns a CheckResult. Extend BaseCheck and the name comes from the class name, so PaymentGatewayCheck becomes payment_gateway:
namespace App\Health; use Cbox\LaravelHealth\Checks\BaseCheck;use Cbox\LaravelHealth\DataTransferObjects\CheckResult;use Illuminate\Support\Facades\Http; class PaymentGatewayCheck extends BaseCheck{ public function run(): CheckResult { try { $response = Http::timeout(5)->get('https://payments.example.com/health'); } catch (\Throwable $e) { return CheckResult::critical($this->name(), $e->getMessage()); } if ($response->successful()) { return CheckResult::ok($this->name()); } return CheckResult::critical($this->name(), "HTTP {$response->status()}"); }}Add the class to the readiness array in config/health.php. CheckResult has four constructors: ok(), warning(), critical(), and unknown(). Each accepts a metadata array as its third argument, and the status and JSON responses include it. The built-in QueueCheck uses the metadata to report queue_size.
Installation
Version 2.0.0 requires PHP 8.3 and Laravel 11, 12, or 13:
composer require cboxdk/laravel-healthphp artisan vendor:publish --tag="health-config"Run the checks from the terminal to confirm the setup:
php artisan health:checkphp artisan health:check --endpoint=readinessWithout the option, the command runs the liveness and readiness checks. The HEALTH_PREFIX environment variable changes the /health prefix, and each endpoint has its own path and enabled keys if you prefer /readyz.
The source and the full documentation are on GitHub.